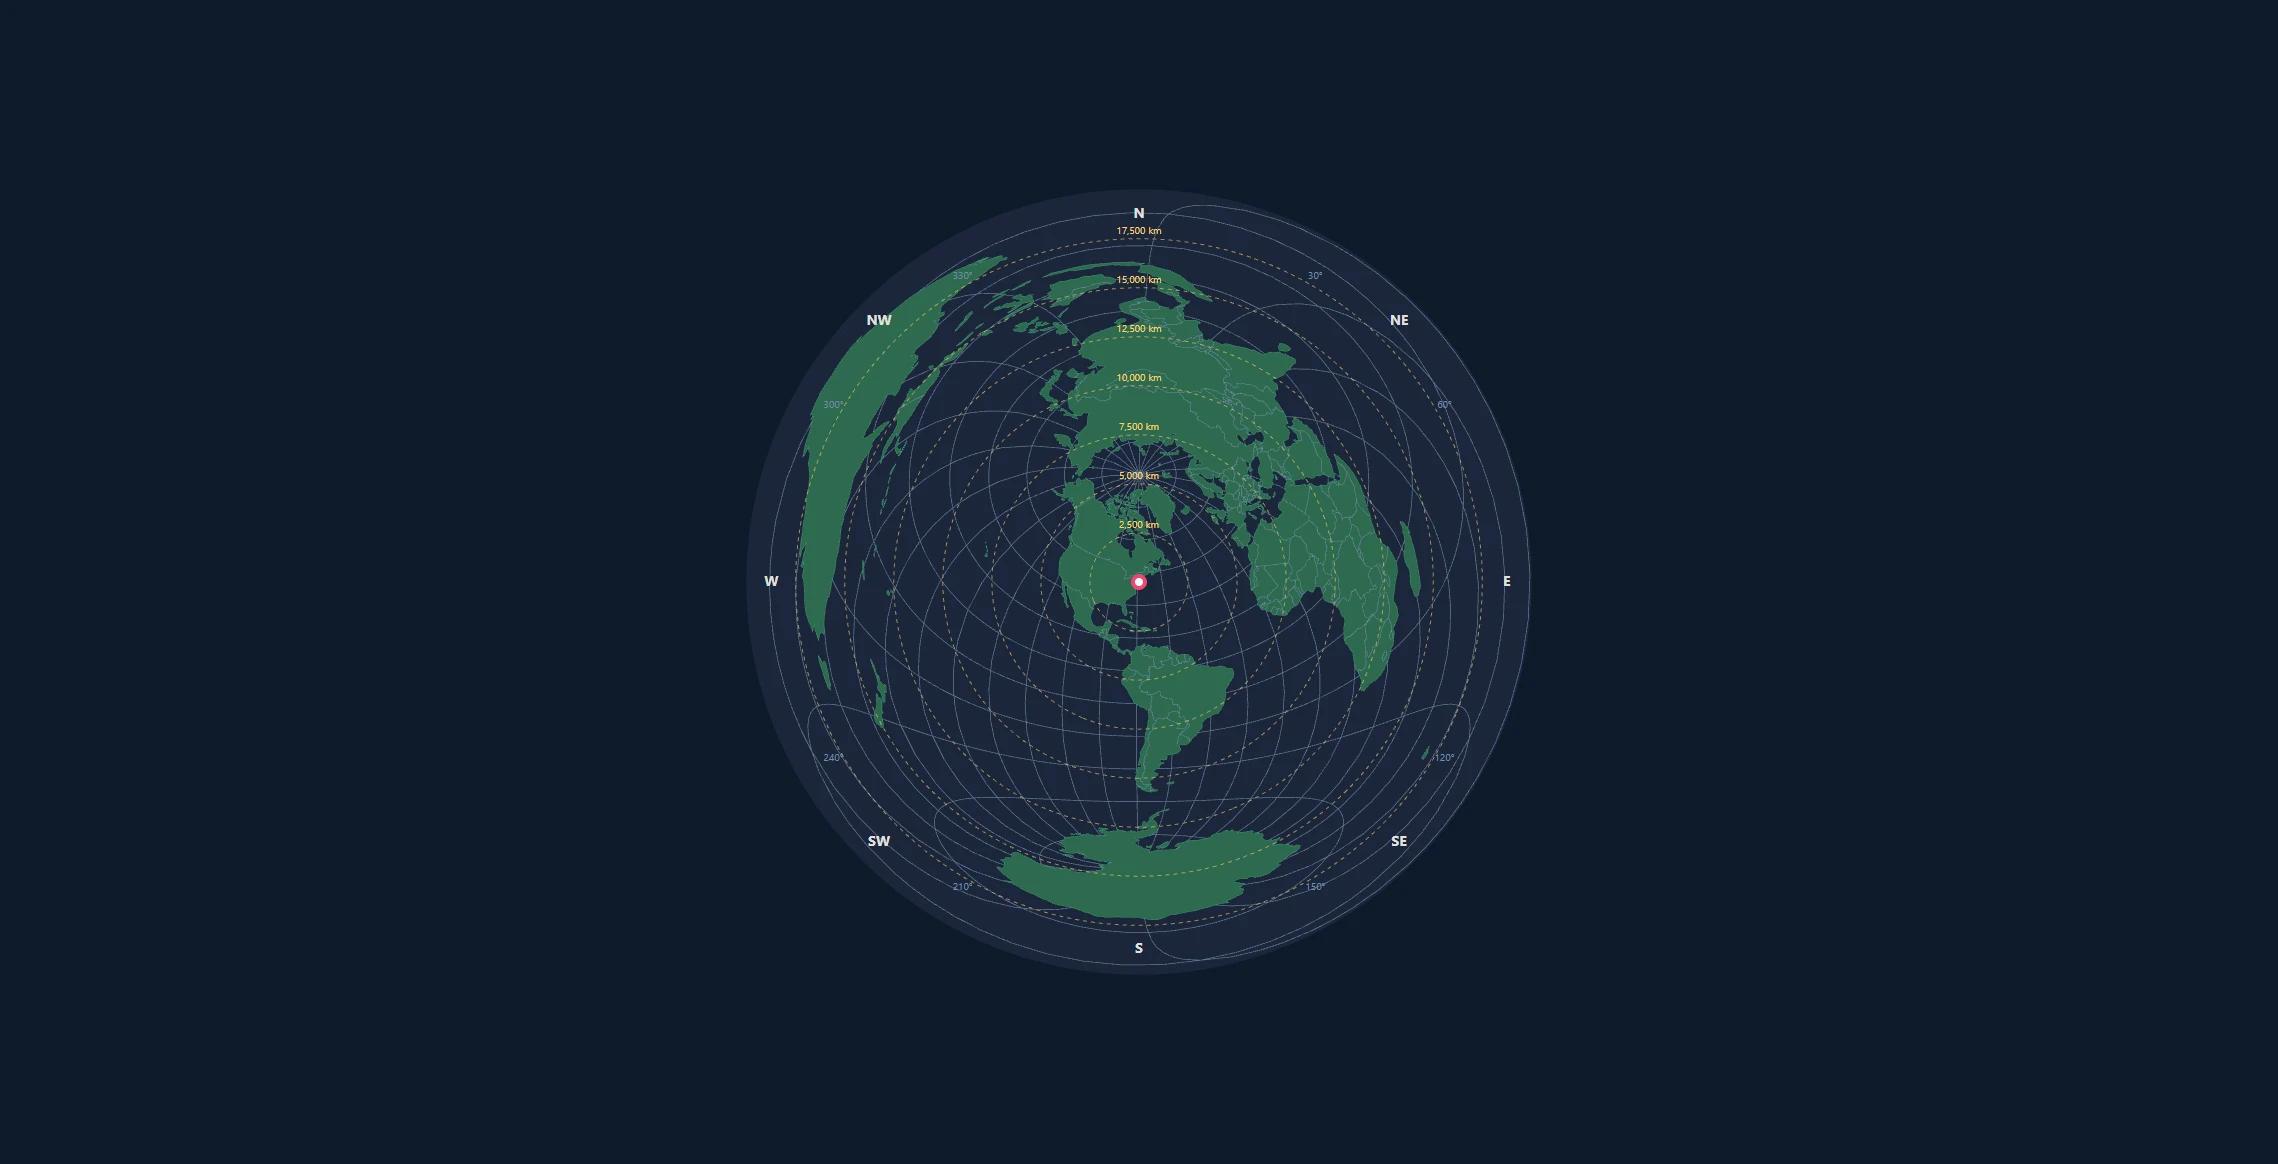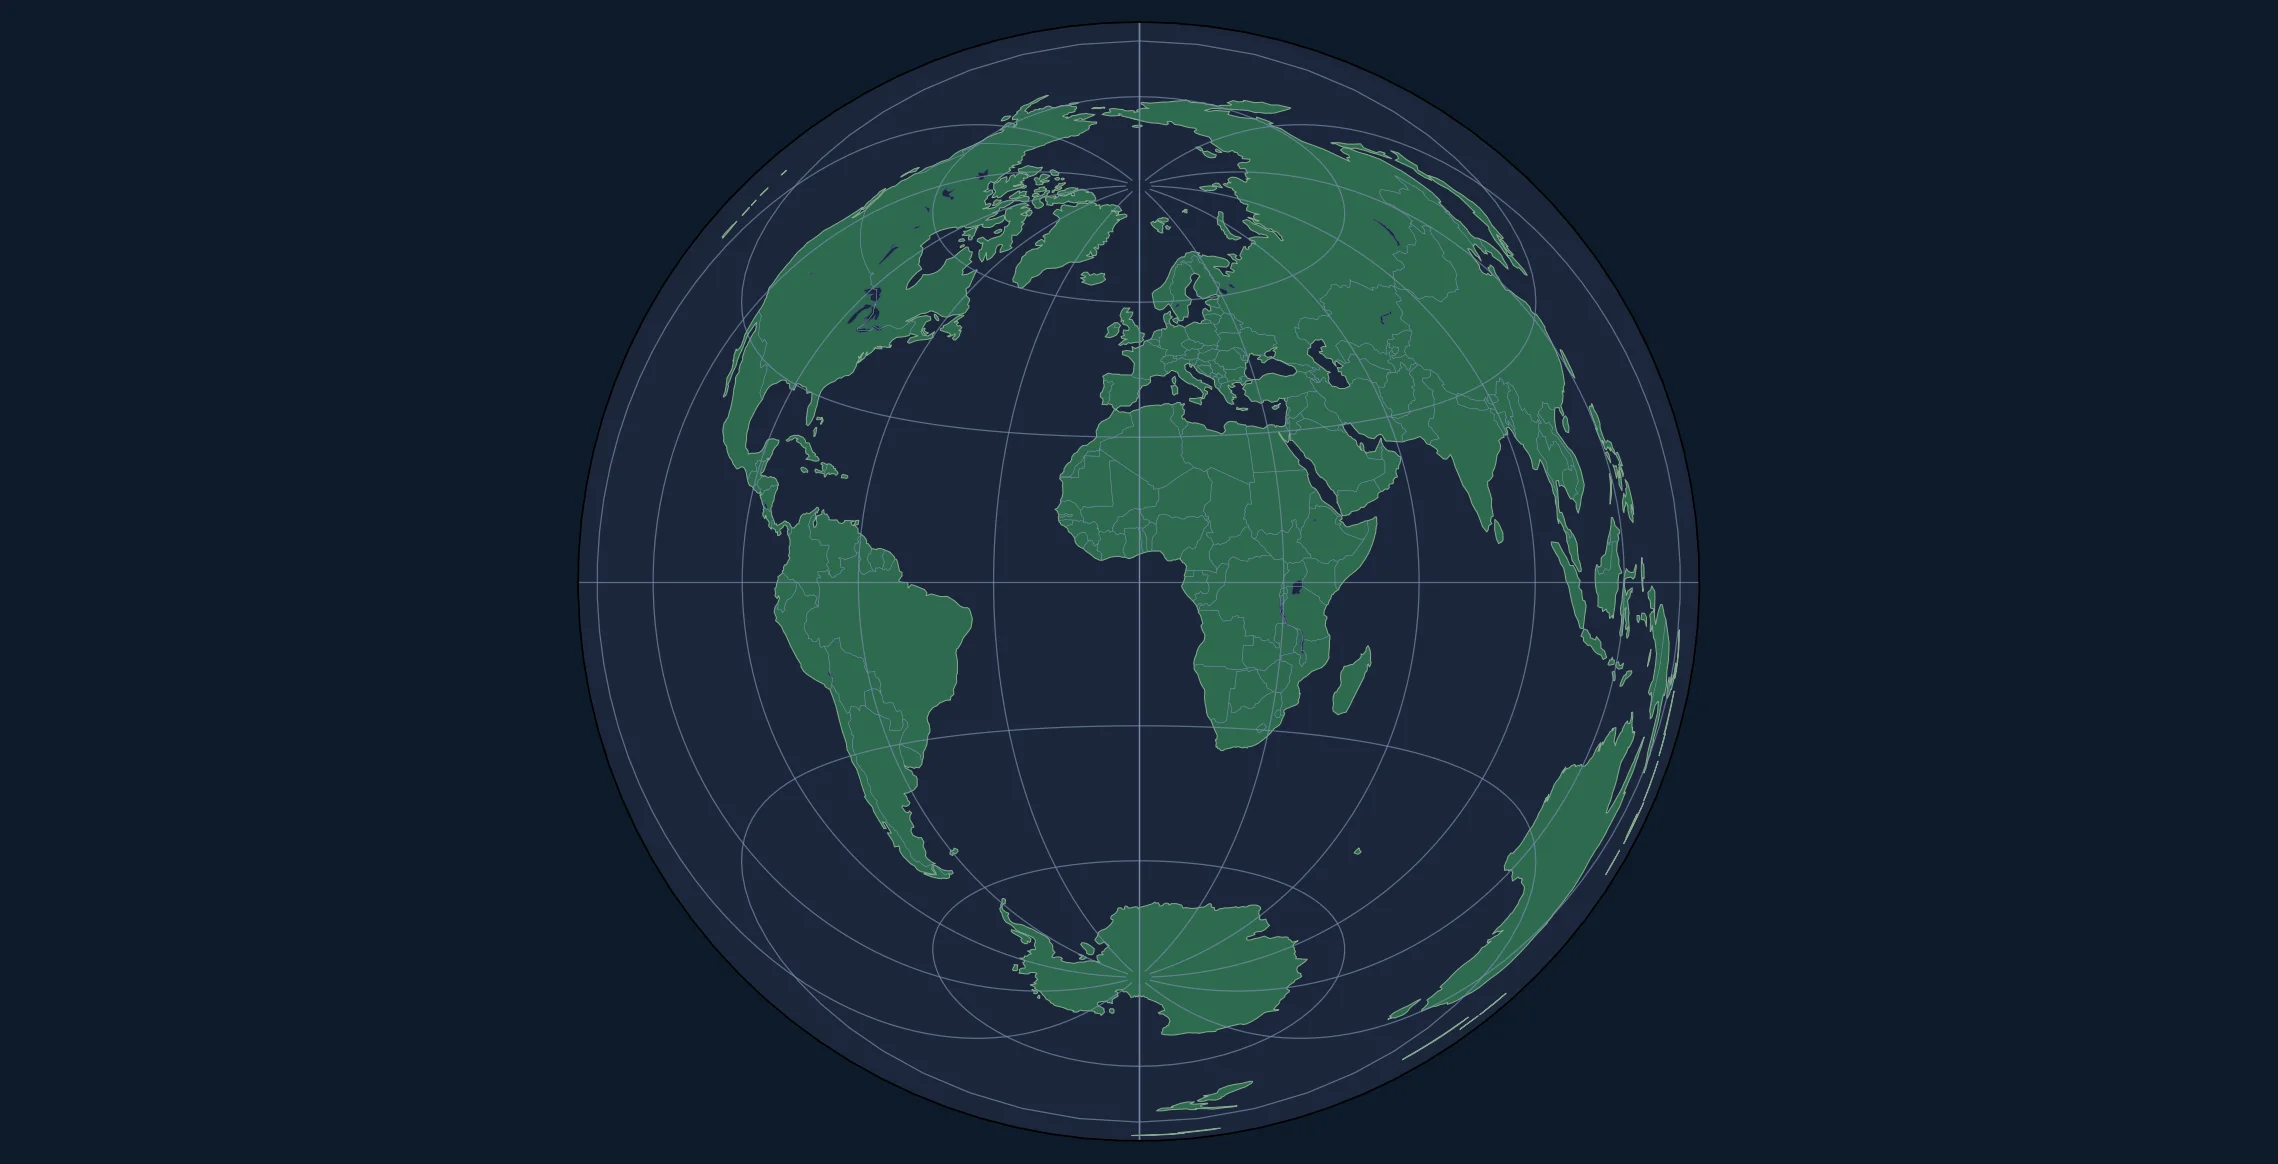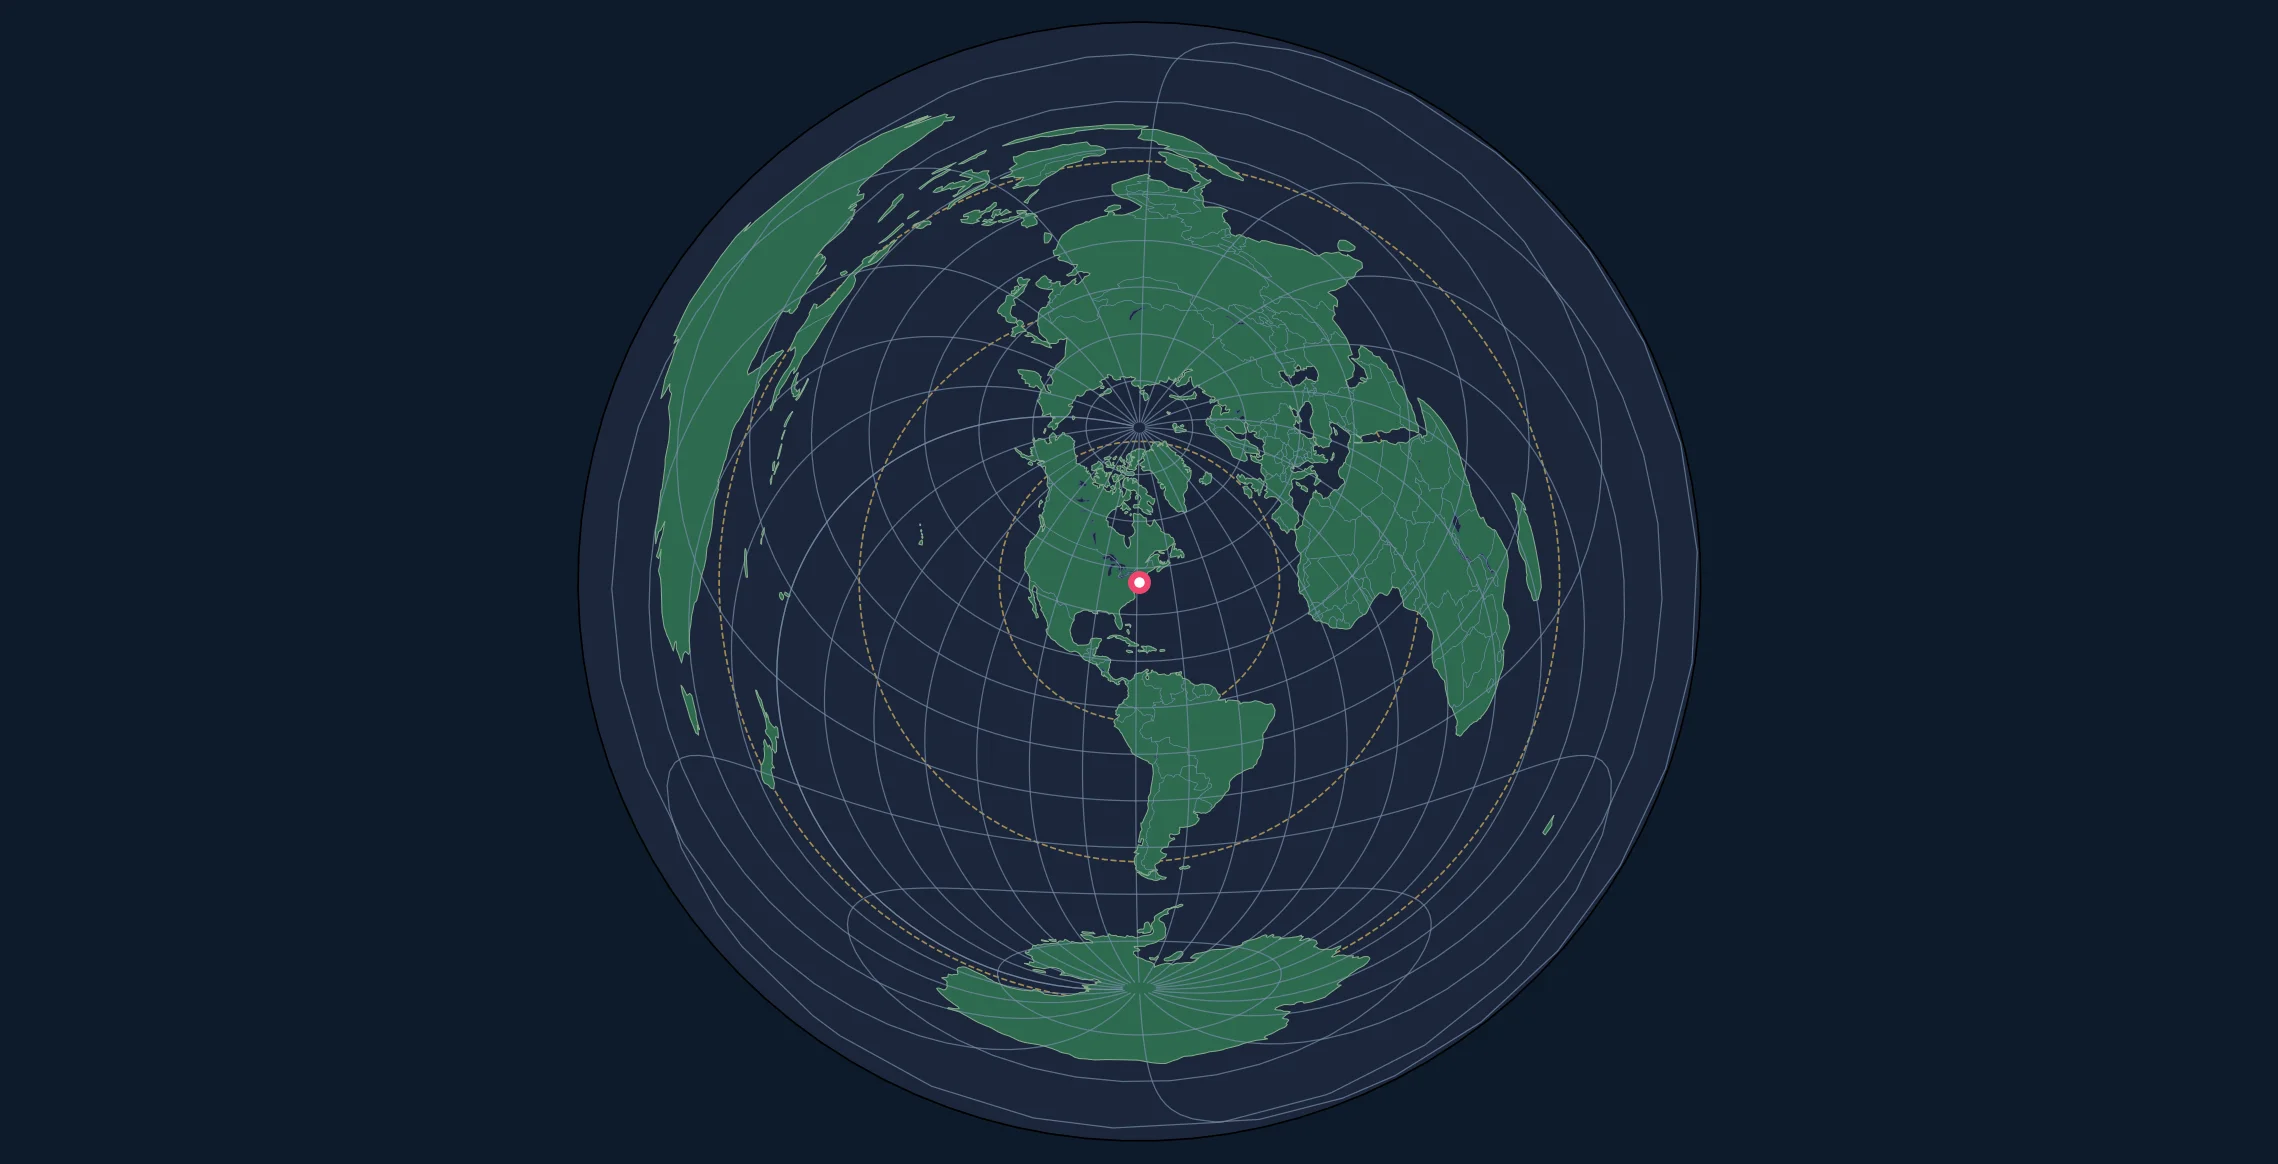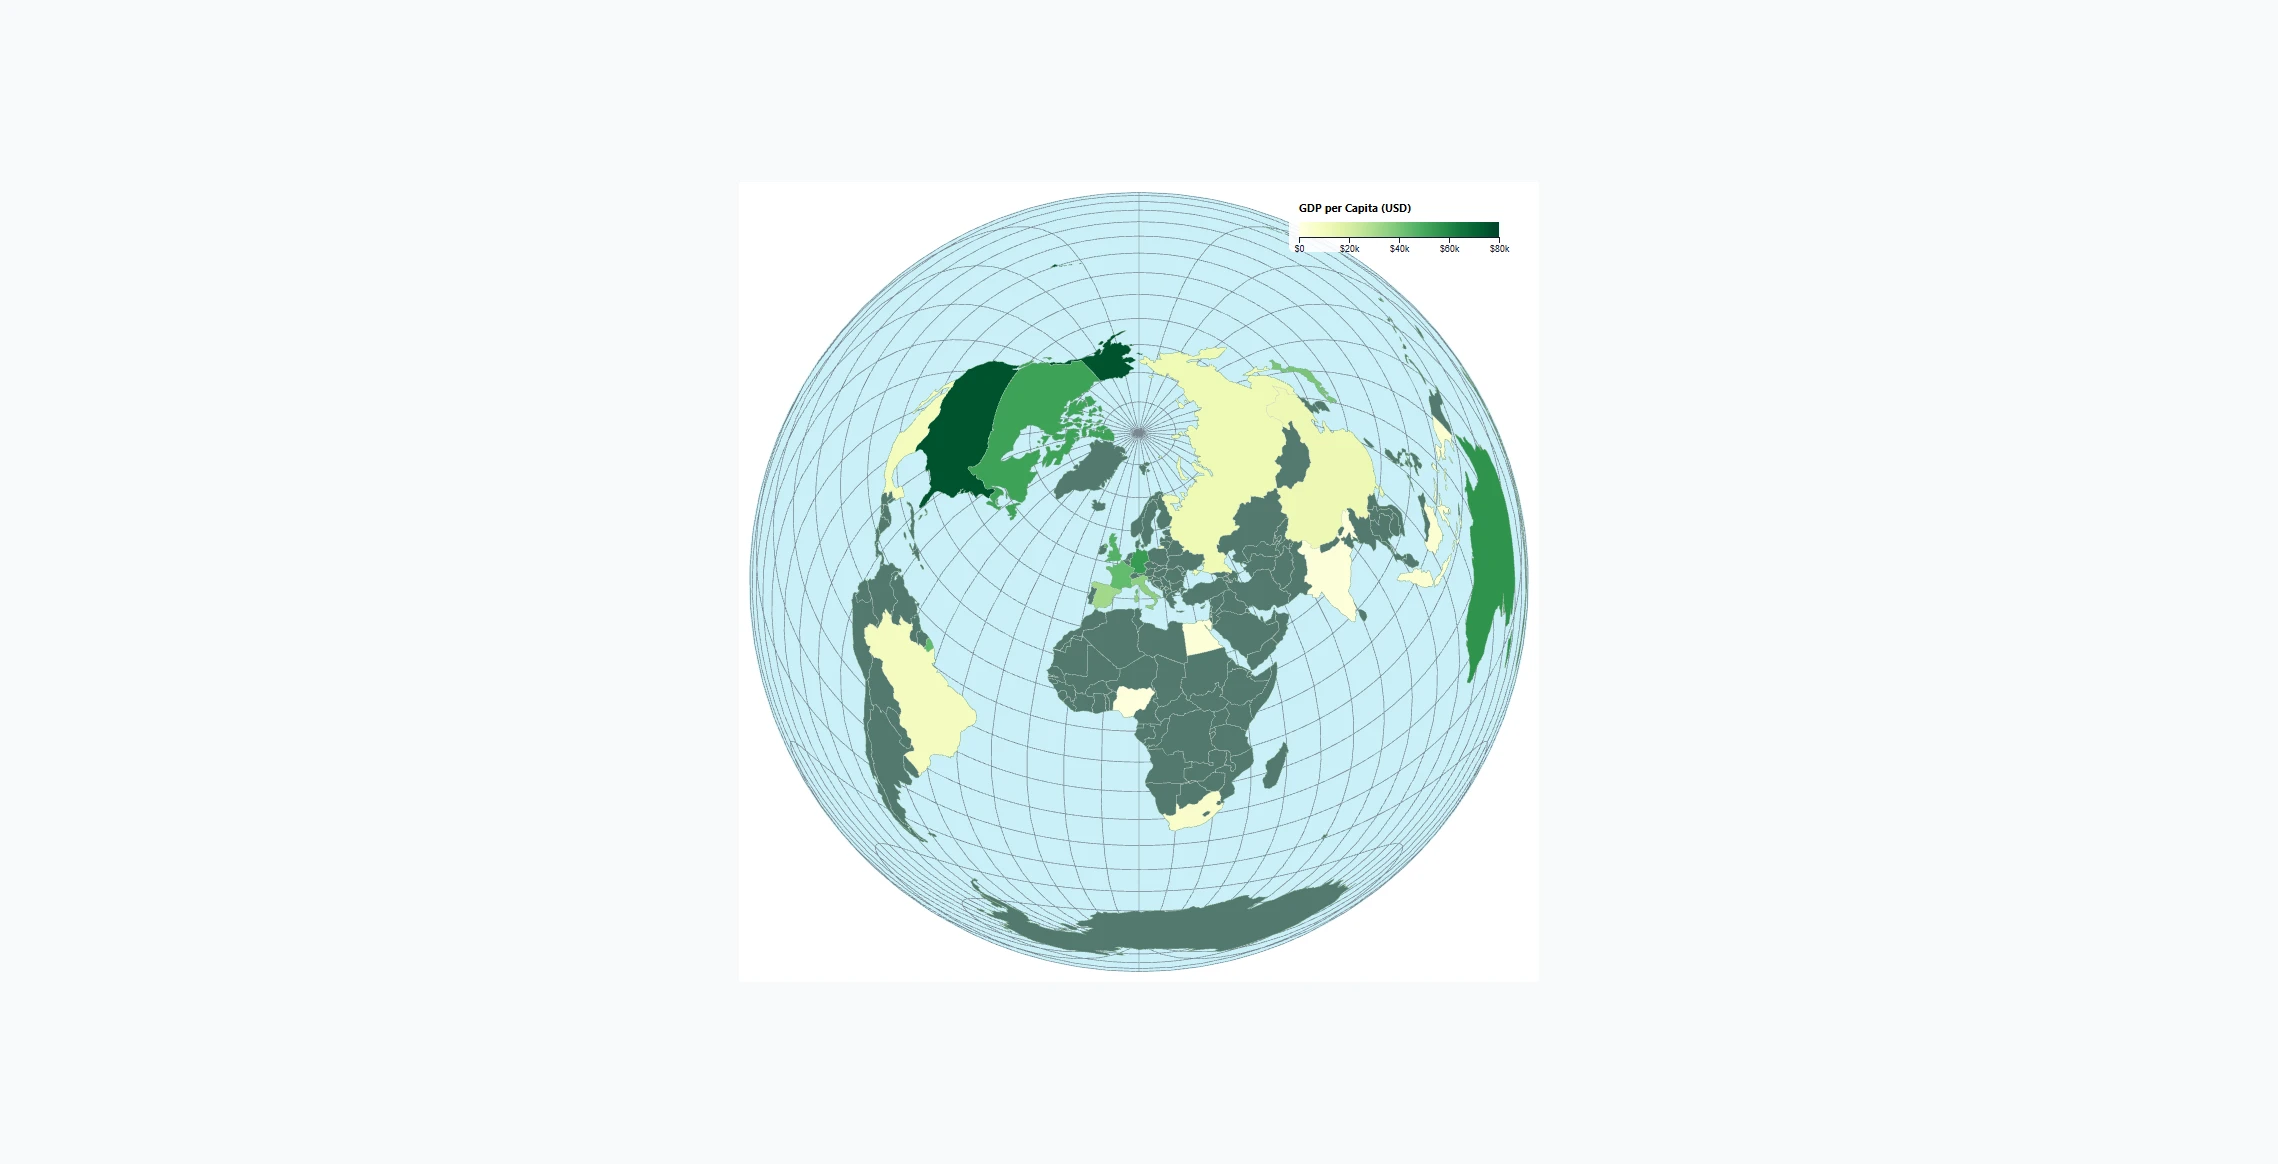
Introduction
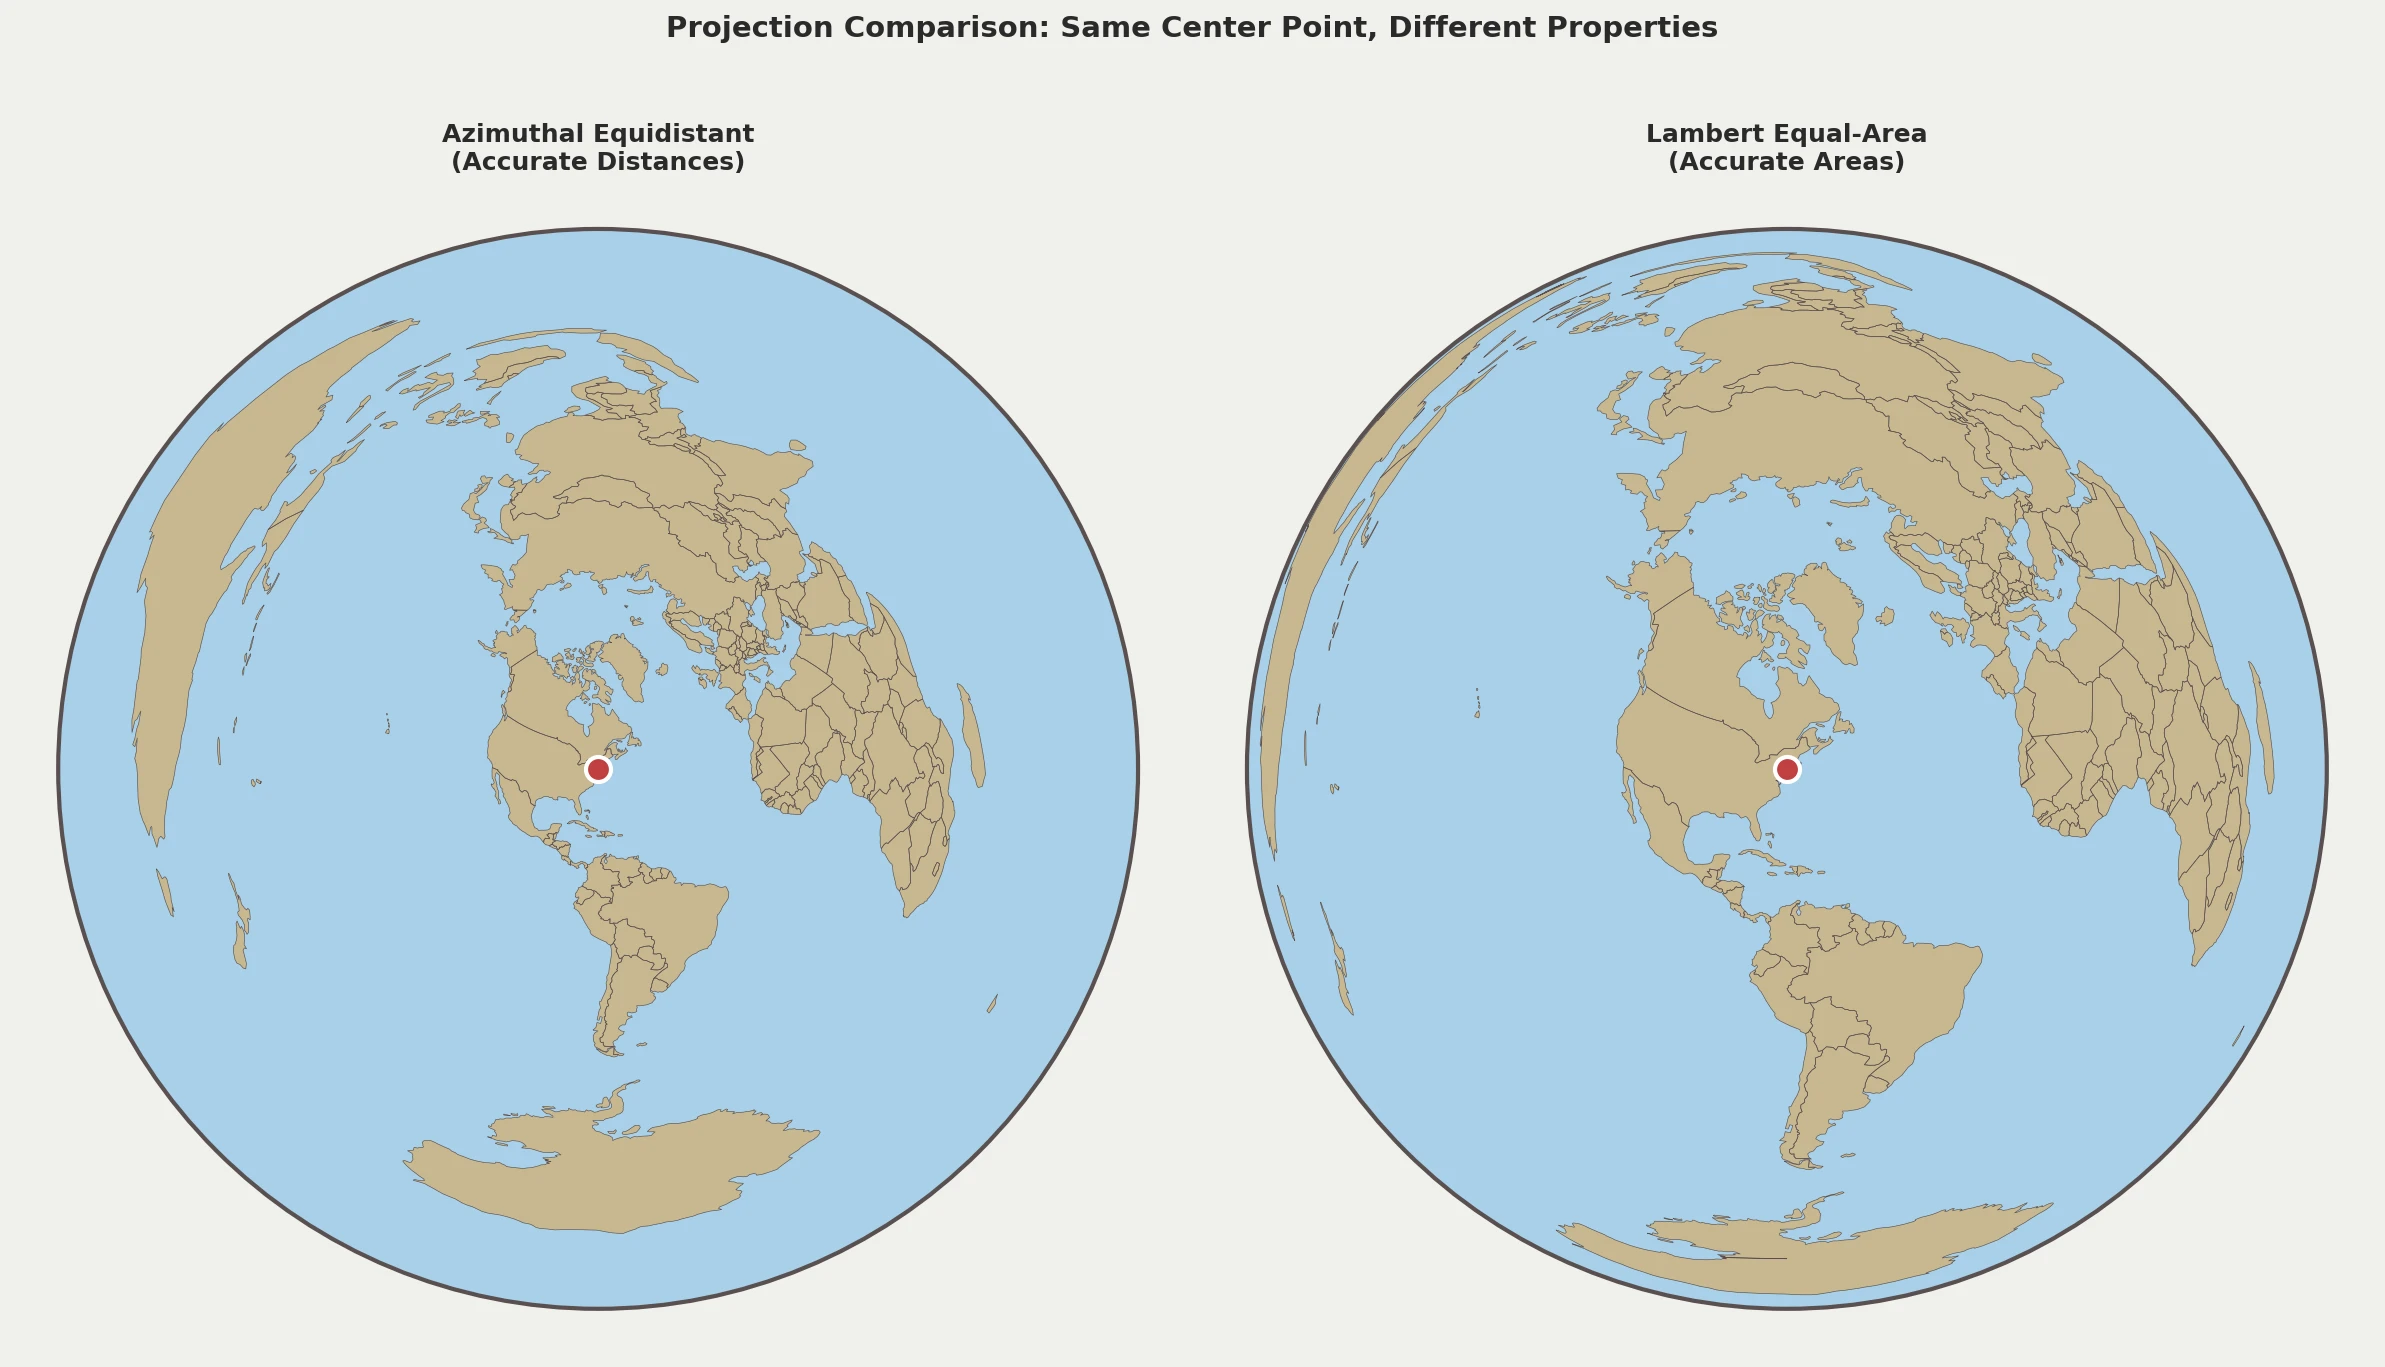
While the azimuthal equidistant projection preserves distances from a center point, the Lambert Azimuthal Equal-Area projection preserves something different: area. Every region on the map has the same proportional area as on the actual Earth.
This makes it invaluable for:
- Thematic maps showing population density, land use, or resources
- Statistical visualizations where area represents data
- Climate and environmental maps where accurate area comparison matters
- Choropleth maps that shade regions by data values
In this tutorial, you'll learn how to create Lambert Equal-Area maps with D3.js, understand when to choose this projection, and implement interactive features.
Equal-Area vs Equidistant: When to Use Which?
| Property | Equidistant | Equal-Area |
|---|---|---|
| Preserves | Distance from center | Area/size of regions |
| Best for | Navigation, radio, distance measurement | Thematic maps, statistics |
| Shape distortion | Moderate at edges | More pronounced at edges |
| Distance accuracy | Perfect from center | Not preserved |
Choose Equal-Area when: - Comparing sizes of countries or regions - Creating density maps (population per square km) - Visualizing data where area represents magnitude - Making choropleth or heat maps
Choose Equidistant when: - Measuring distances from a specific point - Navigation or direction finding - Radio propagation or coverage maps
The Mathematics Behind Lambert Equal-Area
The Lambert Azimuthal Equal-Area projection preserves area by adjusting radial and transverse scale. For a unit sphere, the formulas are:
$$x = k' \cdot \cos(\phi) \cdot \sin(\lambda - \lambda_0)$$
$$y = k' \cdot [\cos(\phi_0) \cdot \sin(\phi) - \sin(\phi_0) \cdot \cos(\phi) \cdot \cos(\lambda - \lambda_0)]$$
Where the scale factor $k'$ is:
$$k' = \sqrt{\frac{2}{1 + \sin(\phi_0)\sin(\phi) + \cos(\phi_0)\cos(\phi)\cos(\lambda - \lambda_0)}}$$
Here $(\phi, \lambda)$ is the point, $(\phi_0, \lambda_0)$ is the projection center, and the coordinates are multiplied by sphere radius $R$ when linear units are required. This differs from the equidistant projection's linear radial scaling, creating the area-preserving property at the cost of shape distortion away from the center.
Setting Up Your D3.js Project
HTML Structure
<!DOCTYPE html>
<html lang="en">
<head>
    <meta charset="UTF-8">
    <meta name="viewport" content="width=device-width, initial-scale=1.0">
    <title>Lambert Equal-Area Map - D3.js</title>
    <style>
        body {
            margin: 0;
            display: flex;
            justify-content: center;
            align-items: center;
            min-height: 100vh;
            background: #1a1a2e;
            font-family: system-ui, sans-serif;
        }

        #map-container {
            position: relative;
        }

        .land {
            fill: #52796f;
            stroke: #84a98c;
            stroke-width: 0.5;
        }

        .graticule {
            fill: none;
            stroke: #6c757d;
            stroke-width: 0.7;
            stroke-opacity: 0.85;
        }

        .boundary {
            fill: none;
            stroke: #cad2c5;
            stroke-width: 0.5;
        }

        .ocean {
            fill: #1b263b;
        }

        .country:hover {
            fill: #74c69d;
            cursor: pointer;
        }

        .tooltip {
            position: absolute;
            background: rgba(0, 0, 0, 0.8);
            color: white;
            padding: 8px 12px;
            border-radius: 4px;
            font-size: 12px;
            pointer-events: none;
            opacity: 0;
            transition: opacity 0.2s;
        }
    </style>
</head>
<body>
    <div id="map-container">
        <div class="tooltip"></div>
    </div>

    <script src="https://d3js.org/d3.v7.min.js"></script>
    <script src="https://d3js.org/topojson.v3.min.js"></script>
    <script src="lambert-map.js"></script>
</body>
</html>
Building the Lambert Equal-Area Map
Step 1: Initialize the Projection
The key difference from azimuthal equidistant is using d3.geoAzimuthalEqualArea():
// Configuration
const width = 800;
const height = 800;
const centerLat = 45.0;   // Europe-centered example
const centerLon = 10.0;

// Create SVG
const svg = d3.select("#map-container")
    .append("svg")
    .attr("width", width)
    .attr("height", height);

// Create EQUAL-AREA projection (not equidistant!)
const projection = d3.geoAzimuthalEqualArea()
    .rotate([-centerLon, -centerLat])
    .scale(195)
    .translate([width / 2, height / 2])
    .clipAngle(179.9);  // Full globe view (use 90 for hemisphere)

const path = d3.geoPath().projection(projection);
Step 2: Add Background and Graticule
// Circular clip path for clean edges
svg.append("defs")
    .append("clipPath")
    .attr("id", "map-clip")
    .append("circle")
    .attr("cx", width / 2)
    .attr("cy", height / 2)
    .attr("r", projection.scale() * 2);

// Ocean background
svg.append("circle")
    .attr("cx", width / 2)
    .attr("cy", height / 2)
    .attr("r", projection.scale() * 2)
    .attr("class", "ocean");

// Graticule
const graticule = d3.geoGraticule()
    .step([10, 10]);  // Denser grid for better area reference

svg.append("path")
    .datum(graticule())
    .attr("class", "graticule")
    .attr("d", path)
    .attr("clip-path", "url(#map-clip)");
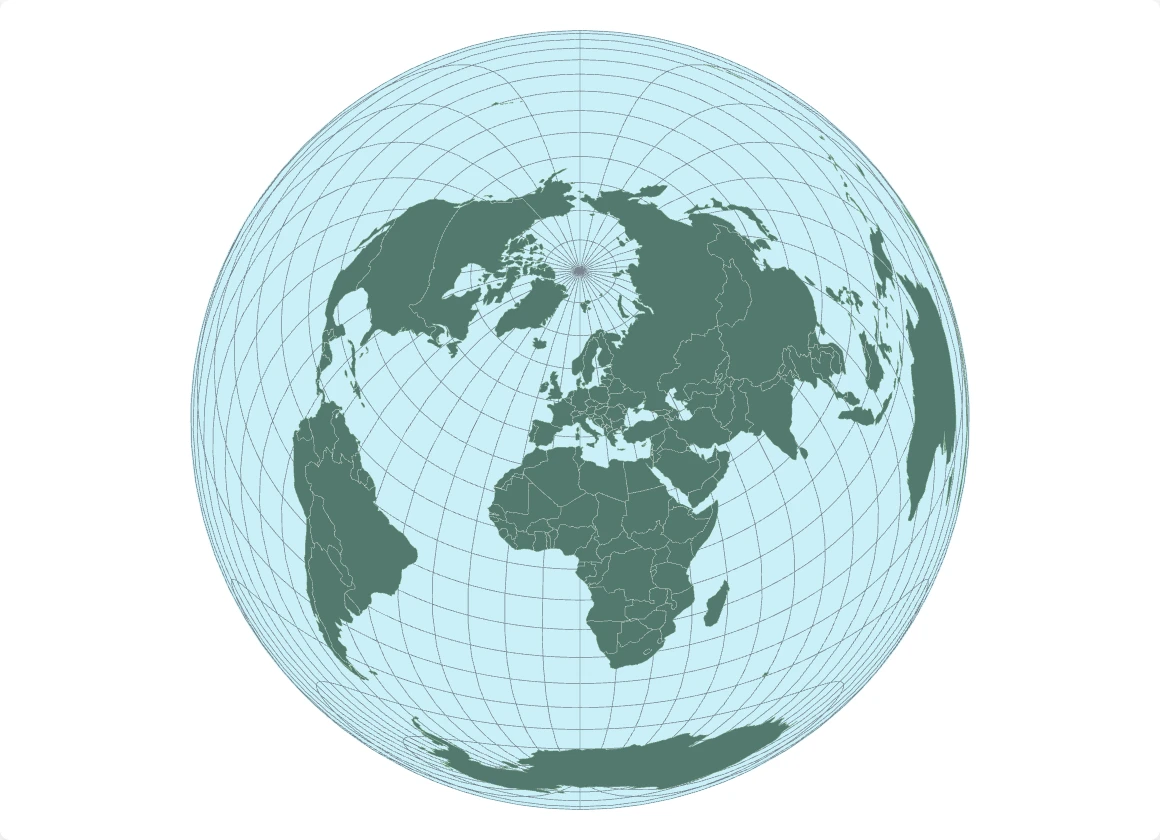
Step 3: Load World Data with Country Interaction
For equal-area maps, we often want to interact with individual countries:
async function loadMap() {
    const world = await d3.json(
        "https://cdn.jsdelivr.net/npm/world-atlas@2/countries-110m.json"
    );

    const countries = topojson.feature(world, world.objects.countries);

    // Draw individual countries (for hover effects)
    svg.selectAll(".country")
        .data(countries.features)
        .join("path")
        .attr("class", "country land")
        .attr("d", path)
        .attr("clip-path", "url(#map-clip)")
        .on("mouseenter", handleMouseEnter)
        .on("mousemove", handleMouseMove)
        .on("mouseleave", handleMouseLeave);

    // Country borders on top
    const borders = topojson.mesh(
        world,
        world.objects.countries,
        (a, b) => a !== b
    );

    svg.append("path")
        .datum(borders)
        .attr("class", "boundary")
        .attr("d", path)
        .attr("clip-path", "url(#map-clip)");
}

loadMap();
Adding Tooltips with Area Information
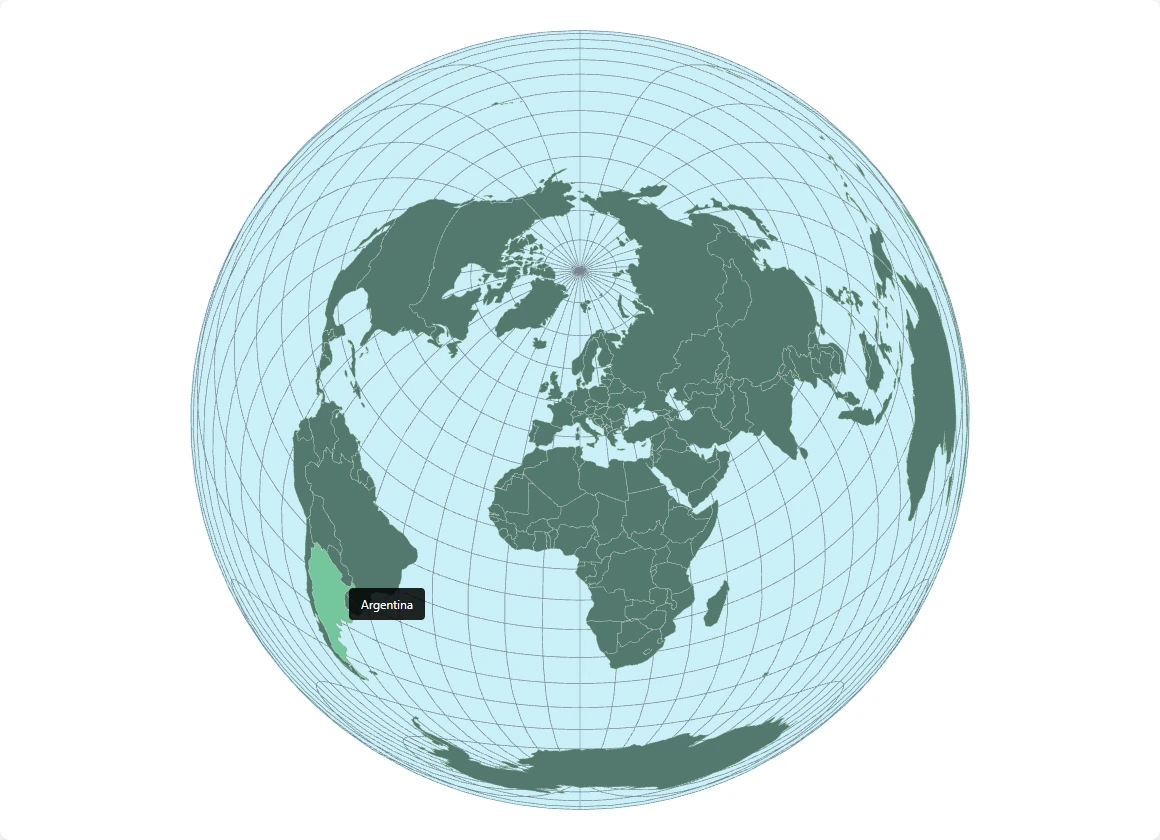
Since this is an equal-area projection, the tooltip can estimate polygon area directly from the displayed geographic data. D3 returns spherical area in steradians, so multiplying by $R^2$ gives square kilometers for a spherical Earth model:
const tooltip = d3.select(".tooltip");

const earthRadiusKm = 6371.0088;

function handleMouseEnter(event, d) {
    const countryName = d.properties.name;
    const area = d3.geoArea(d) * earthRadiusKm ** 2;

    let tooltipText = countryName;
    tooltipText += `<br>Approx. polygon area: ${Math.round(area).toLocaleString()} km²`;

    tooltip
        .html(tooltipText)
        .style("opacity", 1);
}

function handleMouseMove(event) {
    tooltip
        .style("left", (event.offsetX + 15) + "px")
        .style("top", (event.offsetY - 10) + "px");
}

function handleMouseLeave() {
    tooltip.style("opacity", 0);
}
Creating a Choropleth with Equal-Area
One common use for equal-area projections is choropleth mapping. This synthetic index demonstrates the styling; replace it with a cited, dated dataset for a real map:
// Synthetic values for demonstrating the color scale (not observations)
const exampleIndex = {
    "India": 90,
    "Bangladesh": 85,
    "Japan": 75,
    "United Kingdom": 70,
    "Germany": 65,
    "China": 60,
    "France": 55,
    "United States of America": 45,
    "Brazil": 35,
    "Russia": 25,
    "Canada": 15,
    "Australia": 10
};

// Create color scale
const colorScale = d3.scaleSequential()
    .domain([0, 100])
    .interpolator(d3.interpolateYlOrRd);

// Apply colors to countries
svg.selectAll(".country")
    .style("fill", d => {
        const value = exampleIndex[d.properties.name];
        return value !== undefined ? colorScale(value) : "#52796f";
    });
Adding a Legend
function addLegend(svg, colorScale, width) {
    const legendWidth = 200;
    const legendHeight = 15;
    const legendX = width - legendWidth - 30;
    const legendY = 30;

    const legend = svg.append("g")
        .attr("transform", `translate(${legendX}, ${legendY})`);

    // Create gradient
    const defs = svg.append("defs");
    const gradient = defs.append("linearGradient")
        .attr("id", "legend-gradient");

    const numStops = 10;
    for (let i = 0; i <= numStops; i++) {
        const offset = i / numStops;
        gradient.append("stop")
            .attr("offset", `${offset * 100}%`)
            .attr("stop-color", colorScale(offset * 100));
    }

    // Legend rectangle
    legend.append("rect")
        .attr("width", legendWidth)
        .attr("height", legendHeight)
        .style("fill", "url(#legend-gradient)");

    // Legend axis
    const legendScale = d3.scaleLinear()
        .domain([0, 100])
        .range([0, legendWidth]);

    const legendAxis = d3.axisBottom(legendScale)
        .ticks(5);

    legend.append("g")
        .attr("transform", `translate(0, ${legendHeight})`)
        .call(legendAxis)
        .selectAll("text")
        .attr("fill", "#e0e1dd")
        .attr("font-size", "10px");

    legend.append("text")
        .attr("y", -5)
        .attr("fill", "#e0e1dd")
        .attr("font-size", "12px")
        .text("Illustrative Index");
}

addLegend(svg, colorScale, width);
Comparing Projections Side-by-Side
Want to show users the difference between equal-area and equidistant? Create both:
function createComparisonView() {
    const container = d3.select("body")
        .append("div")
        .style("display", "flex")
        .style("gap", "20px");

    // Equal-Area projection
    const svgEqualArea = container.append("svg")
        .attr("width", 400)
        .attr("height", 400);

    const projEqualArea = d3.geoAzimuthalEqualArea()
        .rotate([-centerLon, -centerLat])
        .scale(200)
        .translate([200, 200])
        .clipAngle(90);

    // Equidistant projection
    const svgEquidistant = container.append("svg")
        .attr("width", 400)
        .attr("height", 400);

    const projEquidistant = d3.geoAzimuthalEquidistant()
        .rotate([-centerLon, -centerLat])
        .scale(200)
        .translate([200, 200])
        .clipAngle(90);

    // Render both with same data...
}
Handling Specific Regions
For regional maps (Europe, Africa, etc.), adjust your clip angle and scale:
// Europe-focused view
const europeProjection = d3.geoAzimuthalEqualArea()
    .rotate([-10, -52])     // Center on Europe
    .scale(1000)            // Zoom in
    .translate([width / 2, height / 2])
    .clipAngle(30);         // Show only 30° from center

// Africa-focused view
const africaProjection = d3.geoAzimuthalEqualArea()
    .rotate([-20, 0])       // Center on Africa
    .scale(600)
    .translate([width / 2, height / 2])
    .clipAngle(45);
Animation: Morphing Between Projections
Create a smooth transition between equidistant and equal-area:
let isEqualArea = true;

const projEqualArea = d3.geoAzimuthalEqualArea()
    .rotate([-centerLon, -centerLat])
    .scale(200)
    .translate([width / 2, height / 2]);

const projEquidistant = d3.geoAzimuthalEquidistant()
    .rotate([-centerLon, -centerLat])
    .scale(200)
    .translate([width / 2, height / 2]);

function toggleProjection() {
    const sourceProj = isEqualArea ? projEqualArea : projEquidistant;
    isEqualArea = !isEqualArea;
    const targetProj = isEqualArea ? projEqualArea : projEquidistant;
    const sourcePath = d3.geoPath().projection(sourceProj);
    const targetPath = d3.geoPath().projection(targetProj);

    svg.selectAll("path")
        .transition()
        .duration(1000)
        .attrTween("d", function(d) {
            // Interpolate SVG path strings; geoInterpolate is for coordinates.
            const interpolate = d3.interpolateString(sourcePath(d), targetPath(d));
            return t => interpolate(t);
        })
        .on("end", () => path.projection(targetProj));
}

// Add toggle button
d3.select("body").append("button")
    .text("Toggle Projection")
    .on("click", toggleProjection);
Complete Working Example
(async function() {
    const width = 800;
    const height = 800;
    const centerLat = 45;
    const centerLon = 10;

    const svg = d3.select("#map-container")
        .append("svg")
        .attr("width", width)
        .attr("height", height);

    const projection = d3.geoAzimuthalEqualArea()
        .rotate([-centerLon, -centerLat])
        .scale(400)
        .translate([width / 2, height / 2])
        .clipAngle(90);

    const path = d3.geoPath().projection(projection);

    // Clip path
    svg.append("defs")
        .append("clipPath")
        .attr("id", "map-clip")
        .append("circle")
        .attr("cx", width / 2)
        .attr("cy", height / 2)
        .attr("r", projection.scale() * Math.SQRT2);

    // Ocean
    svg.append("circle")
        .attr("cx", width / 2)
        .attr("cy", height / 2)
        .attr("r", projection.scale() * Math.SQRT2)
        .attr("class", "ocean");

    // Graticule
    svg.append("path")
        .datum(d3.geoGraticule().step([10, 10])())
        .attr("class", "graticule")
        .attr("d", path)
        .attr("clip-path", "url(#map-clip)");

    // Load world
    const world = await d3.json(
        "https://cdn.jsdelivr.net/npm/world-atlas@2/countries-110m.json"
    );

    const land = topojson.feature(world, world.objects.land);
    const borders = topojson.mesh(world, world.objects.countries, (a, b) => a !== b);

    svg.append("path")
        .datum(land)
        .attr("class", "land")
        .attr("d", path)
        .attr("clip-path", "url(#map-clip)");

    svg.append("path")
        .datum(borders)
        .attr("class", "boundary")
        .attr("d", path)
        .attr("clip-path", "url(#map-clip)");

    // Title
    svg.append("text")
        .attr("x", width / 2)
        .attr("y", 30)
        .attr("text-anchor", "middle")
        .attr("fill", "#e0e1dd")
        .attr("font-size", "18px")
        .text("Lambert Azimuthal Equal-Area Projection");

    console.log("Lambert Equal-Area map rendered");
})();
Key Differences from Equidistant Code
| Aspect | Equidistant | Equal-Area |
|---|---|---|
| Projection | d3.geoAzimuthalEquidistant() |
d3.geoAzimuthalEqualArea() |
| Radius calculation | scale * π |
scale * 2 |
| Common clip angles | 180° (full globe) | 90° (hemisphere) or 180° (full globe) |
| Primary use | Distance rings | Choropleth coloring |
Next Steps
- Add data-driven coloring for choropleth maps
- Implement smooth projection transitions
- Create printable high-resolution exports
- Build a Python version with Cartopy