Introduction
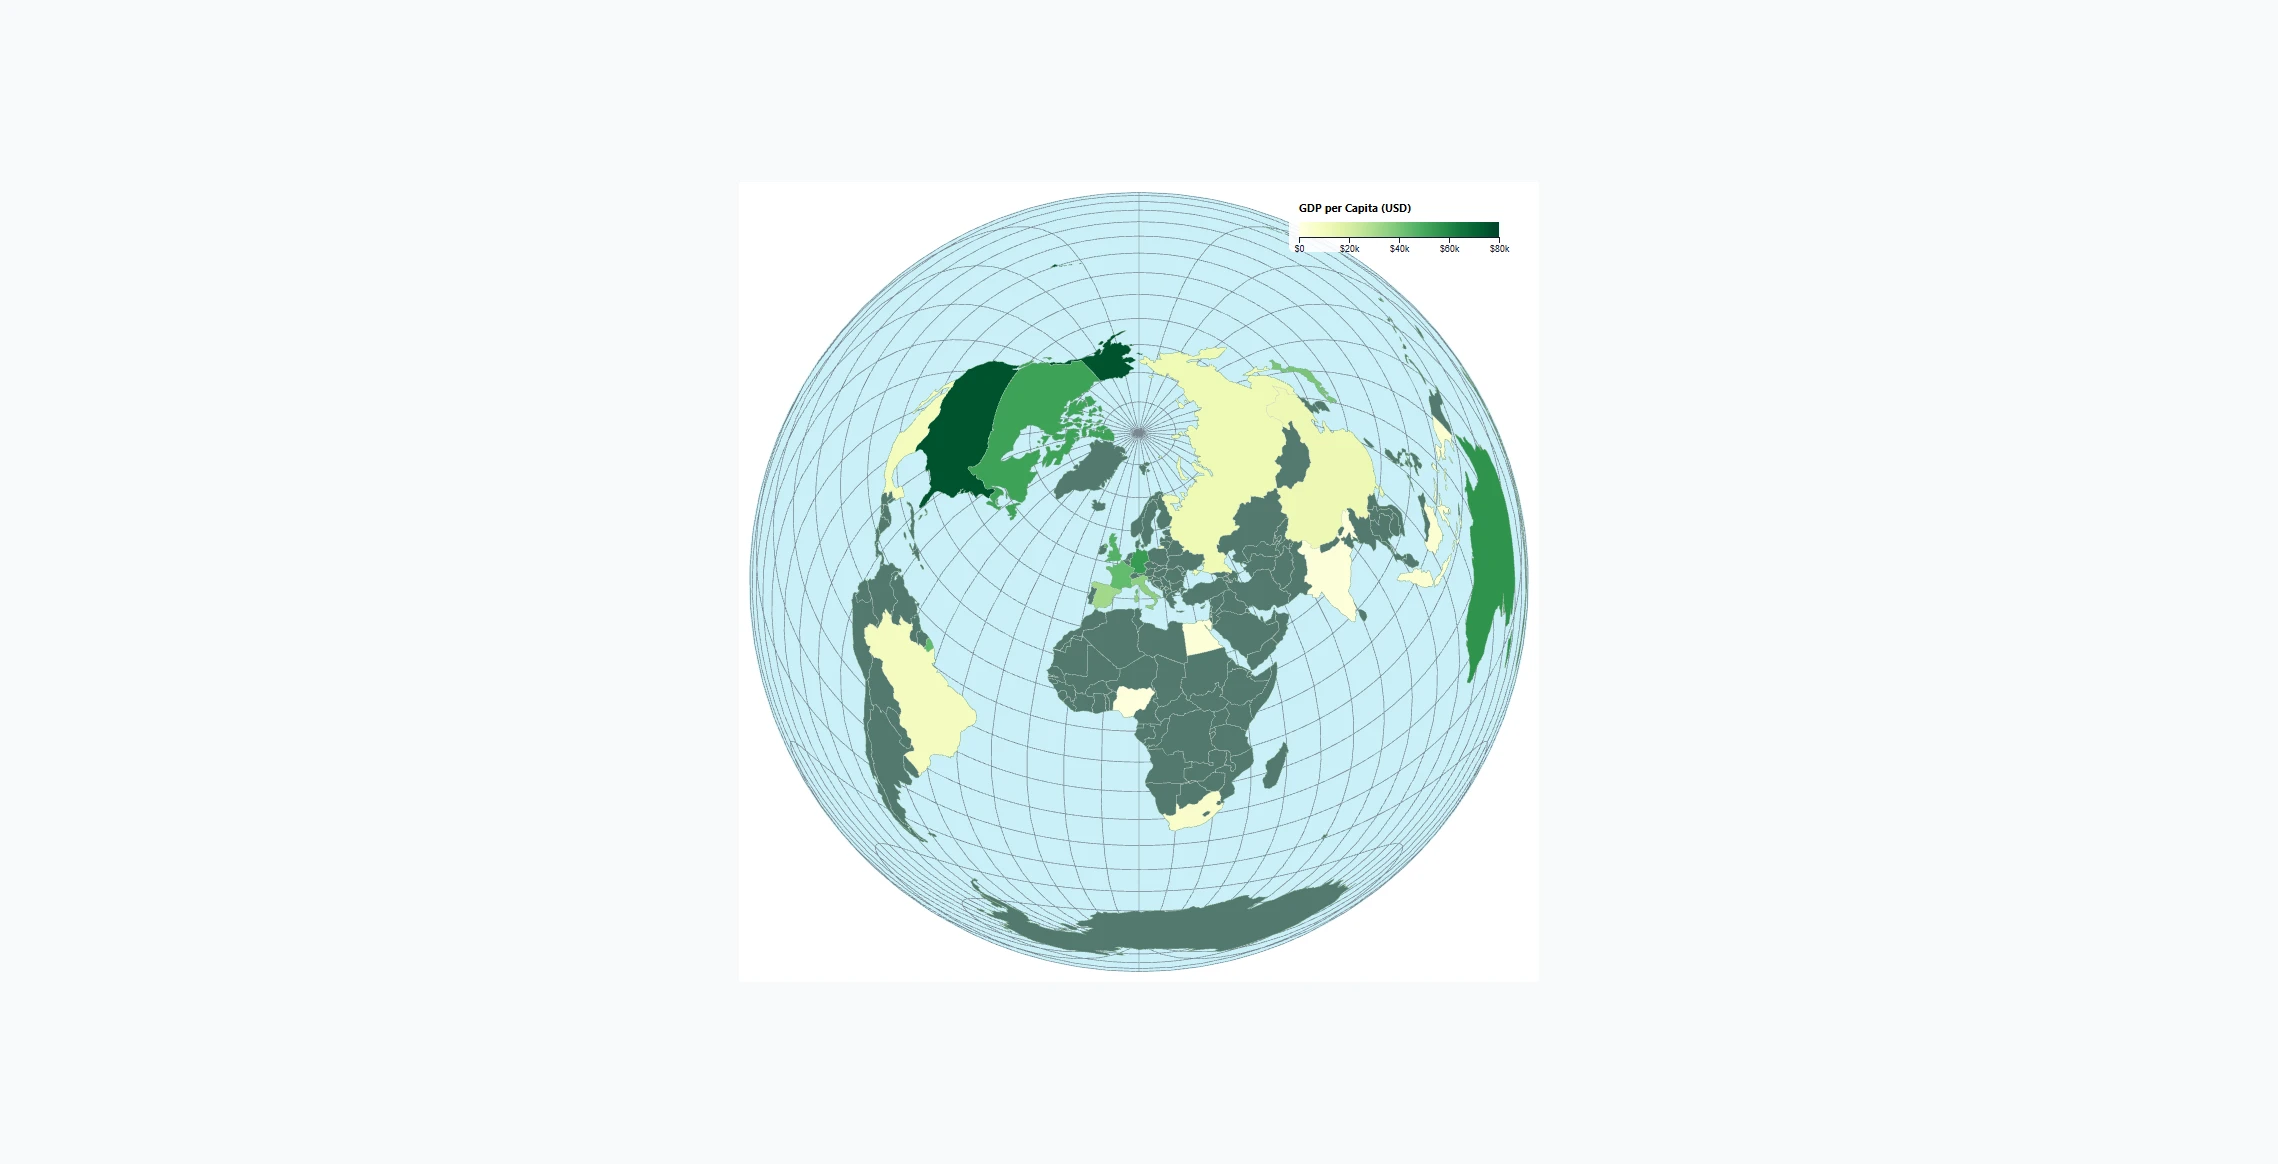
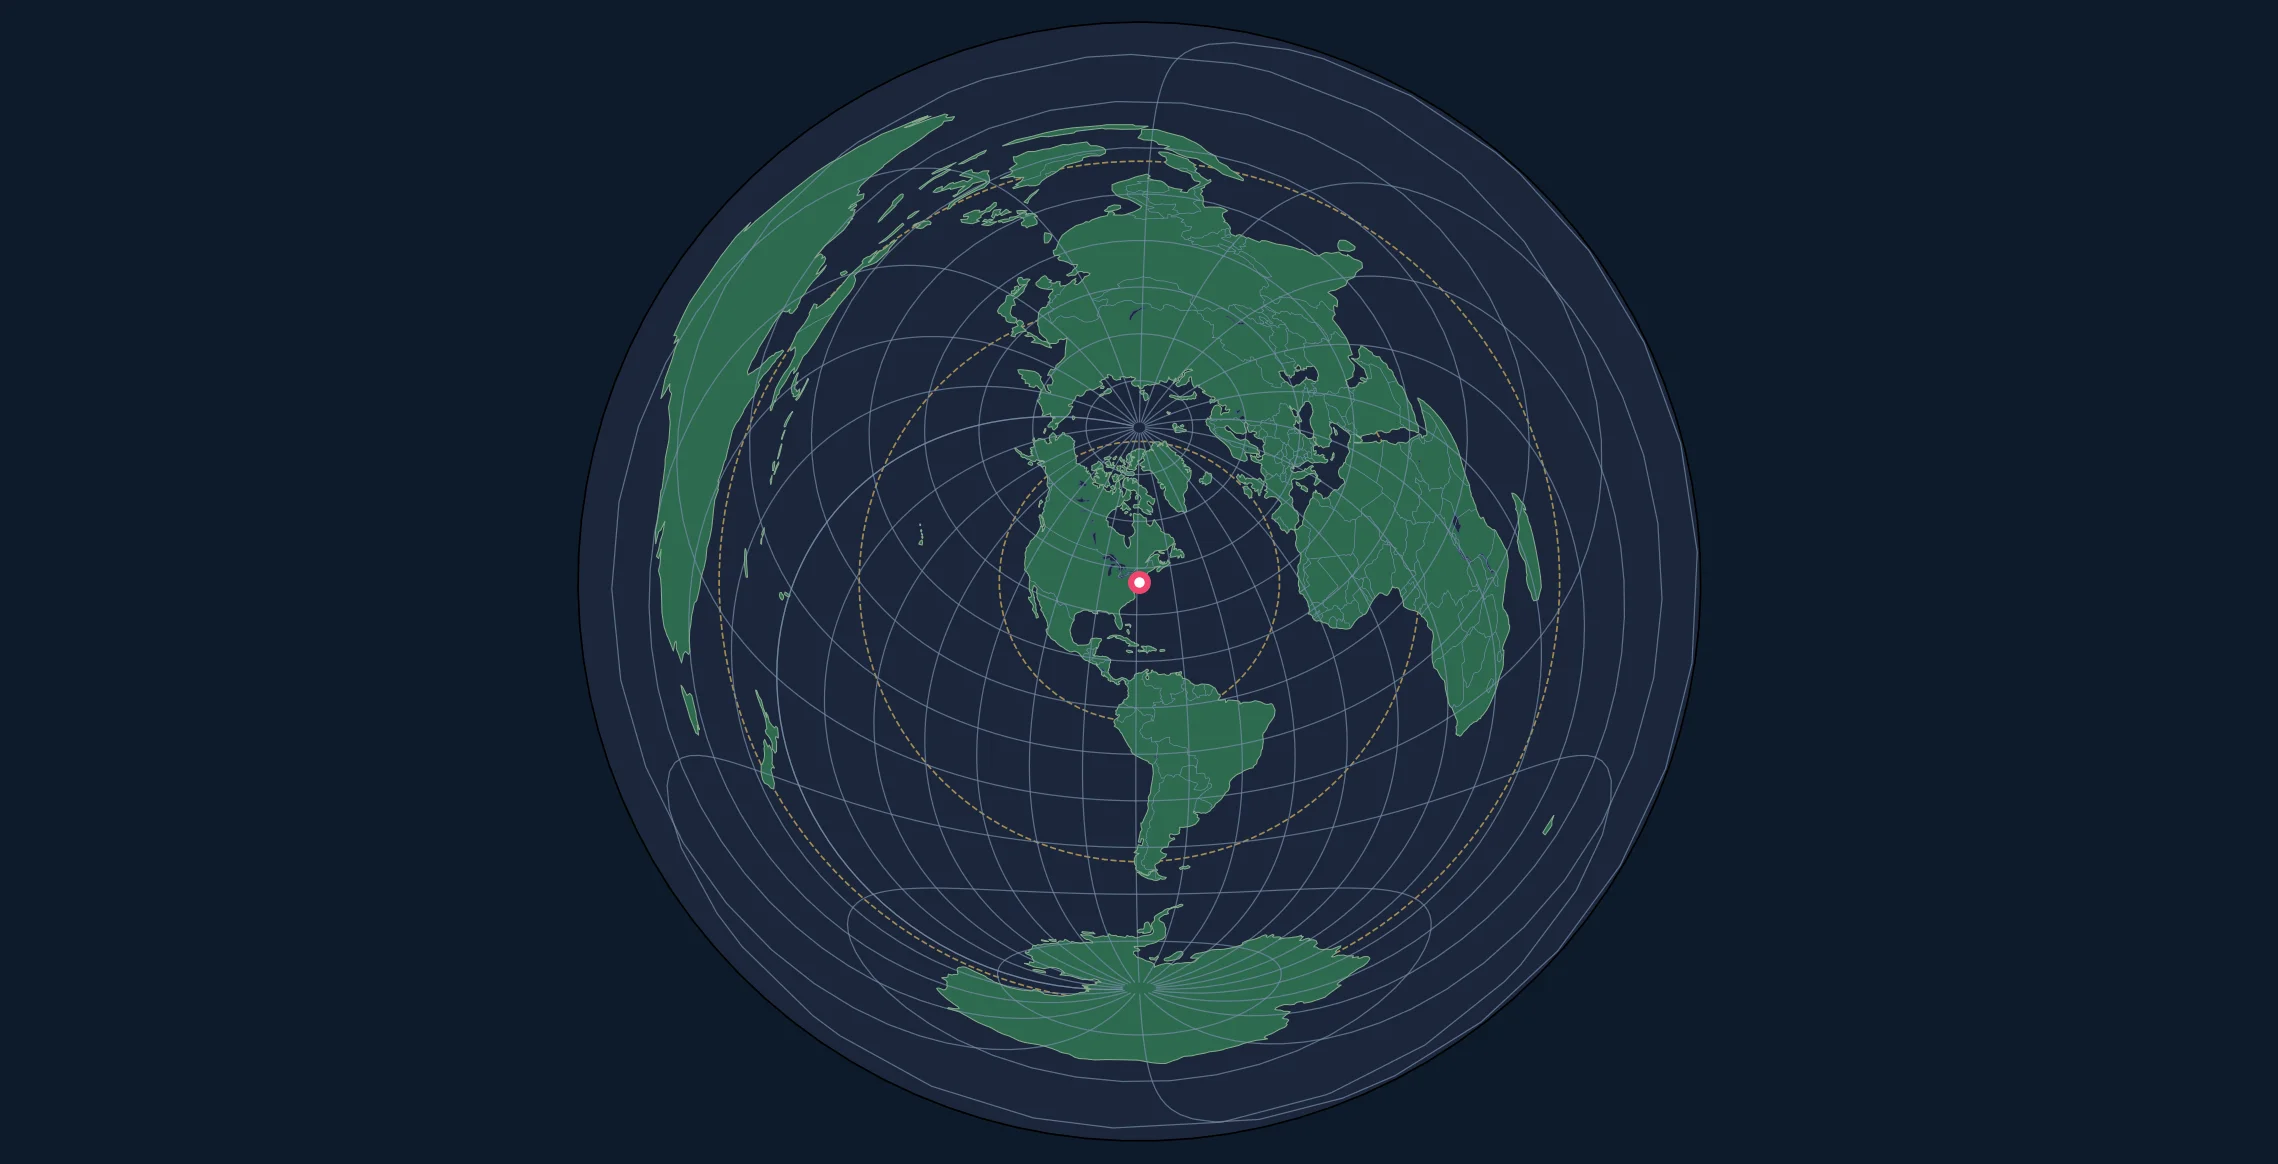
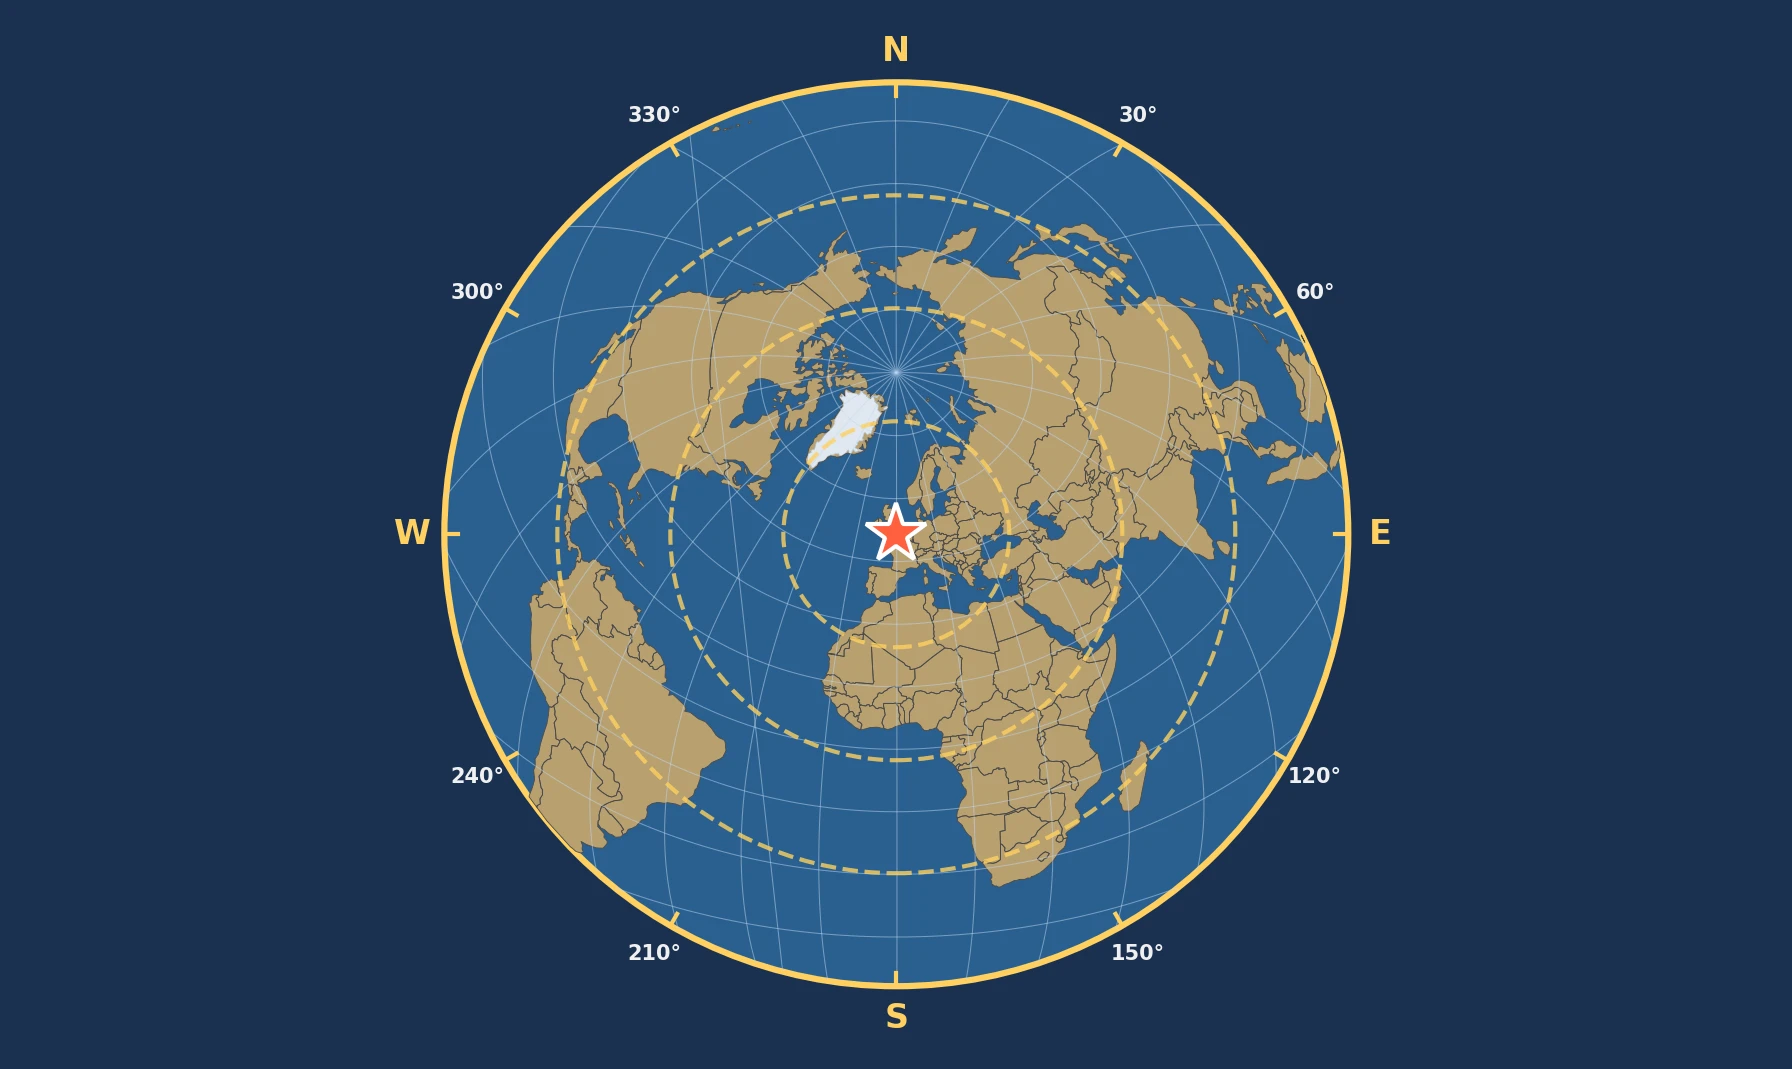
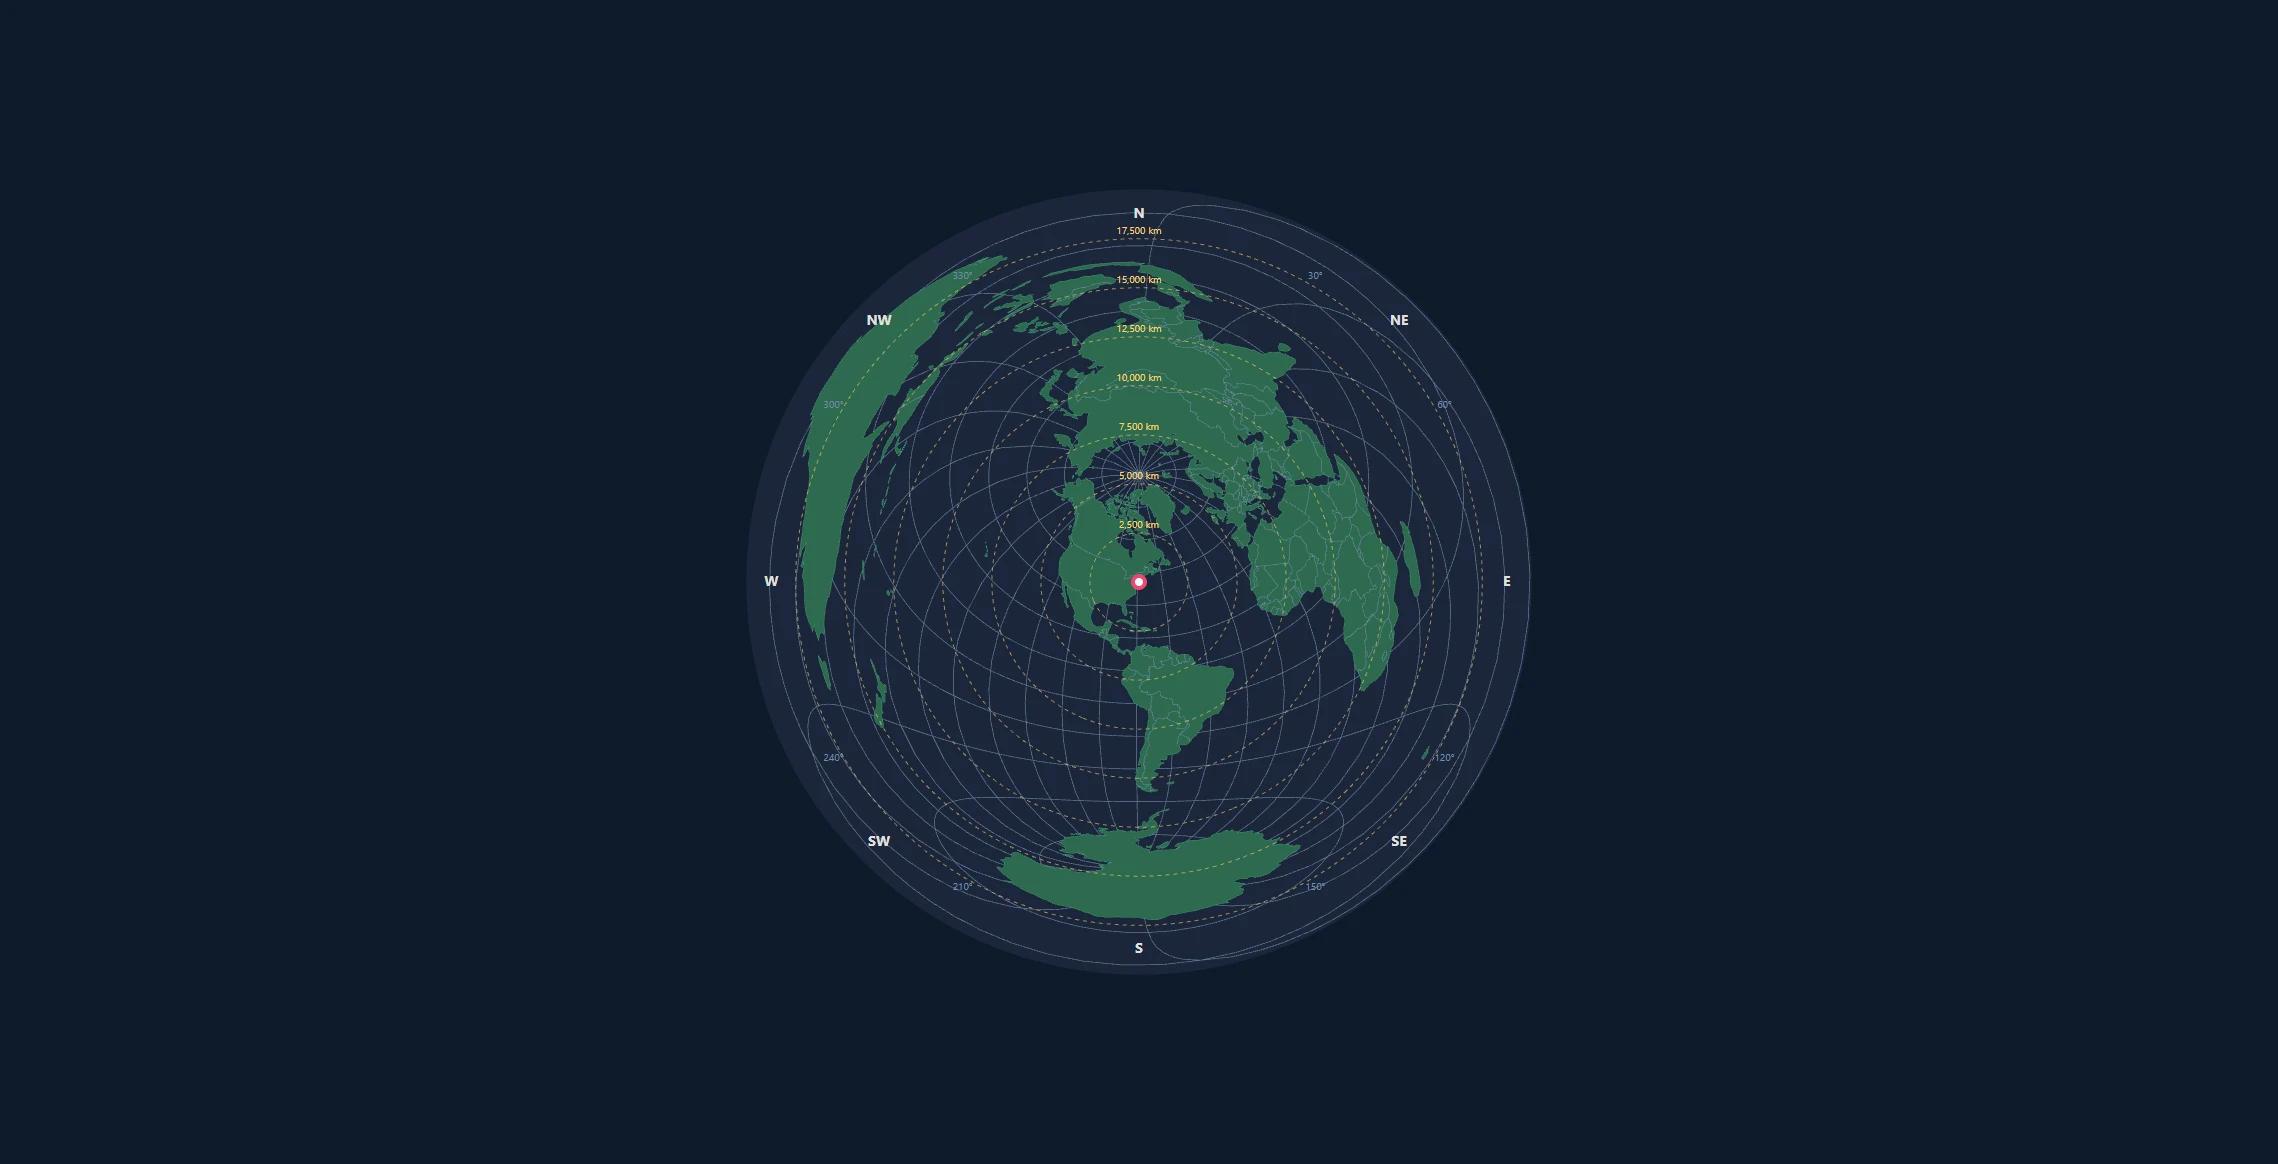
D3.js (Data-Driven Documents) includes geographic projection and SVG path tools for browser-based maps. In this tutorial, you'll learn how to create azimuthal equidistant maps, which preserve spherical distances and initial directions from a center point.
By the end of this guide, you'll be able to:
- Set up a D3.js project with geo projections
- Create an azimuthal equidistant map centered on any location
- Add graticules (latitude/longitude grid lines)
- Draw country boundaries and coastlines
- Add distance rings and azimuth labels
- Make the map interactive with pan and zoom
Prerequisites
Before starting, you should have:
- Basic knowledge of HTML, CSS, and JavaScript
- Node.js installed (for local development) or use a CDN
- A text editor or IDE
- Understanding of basic cartographic concepts
Setting Up Your Project
HTML Structure
Create an index.html file with the following structure:
<!DOCTYPE html>
<html lang="en">
<head>
    <meta charset="UTF-8">
    <meta name="viewport" content="width=device-width, initial-scale=1.0">
    <title>Azimuthal Equidistant Map - D3.js</title>
    <style>
        body {
            margin: 0;
            display: flex;
            justify-content: center;
            align-items: center;
            min-height: 100vh;
            background: #1a1a2e;
        }

        #map-container {
            background: #0d1b2a;
            border-radius: 50%;
            overflow: hidden;
        }

        .land {
            fill: #2d6a4f;
            stroke: #40916c;
            stroke-width: 0.5;
        }

        .graticule {
            fill: none;
            stroke: #778da9;
            stroke-width: 0.7;
            stroke-opacity: 0.8;
        }

        .boundary {
            fill: none;
            stroke: #778da9;
            stroke-width: 0.5;
        }

        .ocean {
            fill: #0d1b2a;
        }
    </style>
</head>
<body>
    <div id="map-container"></div>

    <script src="https://d3js.org/d3.v7.min.js"></script>
    <script src="https://d3js.org/topojson.v3.min.js"></script>
    <script src="map.js"></script>
</body>
</html>
Getting World Data
D3.js works best with TopoJSON format for geographic data. You can use the Natural Earth dataset:
// We'll load world data from a CDN
const worldDataUrl = "https://cdn.jsdelivr.net/npm/world-atlas@2/countries-110m.json";
Understanding the Azimuthal Equidistant Projection
The Mathematics
The azimuthal equidistant projection maps the sphere onto a plane such that:
- All points are at their true spherical distance from the center point
- All points except the antipode are in their true initial direction (azimuth) from the center
The projection formulas are:
$$x = k \cdot \cos(\phi) \cdot \sin(\lambda - \lambda_0)$$
$$y = k \cdot [\cos(\phi_0) \cdot \sin(\phi) - \sin(\phi_0) \cdot \cos(\phi) \cdot \cos(\lambda - \lambda_0)]$$
Where: - $(\phi, \lambda)$ is the point's latitude and longitude - $(\phi_0, \lambda_0)$ is the center point - $k$ is a scale factor based on angular distance from center
D3's Implementation
D3.js handles all this math for you with d3.geoAzimuthalEquidistant():
const projection = d3.geoAzimuthalEquidistant()
    .rotate([-centerLon, -centerLat])  // Note: negative values!
    .scale(200)
    .translate([width / 2, height / 2]);
Important: D3 uses .rotate() with negative longitude and latitude values because it rotates the globe under a fixed projection plane.
Building the Map
Step 1: Basic Setup
Create map.js:
// Configuration
const width = 800;
const height = 800;
const centerLat = 40.7128;   // New York City
const centerLon = -74.0060;

// Create SVG container
const svg = d3.select("#map-container")
    .append("svg")
    .attr("width", width)
    .attr("height", height)
    .attr("viewBox", [0, 0, width, height]);

// Create the projection
const projection = d3.geoAzimuthalEquidistant()
    .rotate([-centerLon, -centerLat])
    .scale(125)
    .translate([width / 2, height / 2])
    .clipAngle(179.9);  // Full globe (use 90 for hemisphere)

// Create path generator
const path = d3.geoPath().projection(projection);

Step 2: Add the Ocean Background
// Add circular ocean background
svg.append("circle")
    .attr("cx", width / 2)
    .attr("cy", height / 2)
    .attr("r", projection.scale() * Math.PI)
    .attr("class", "ocean");
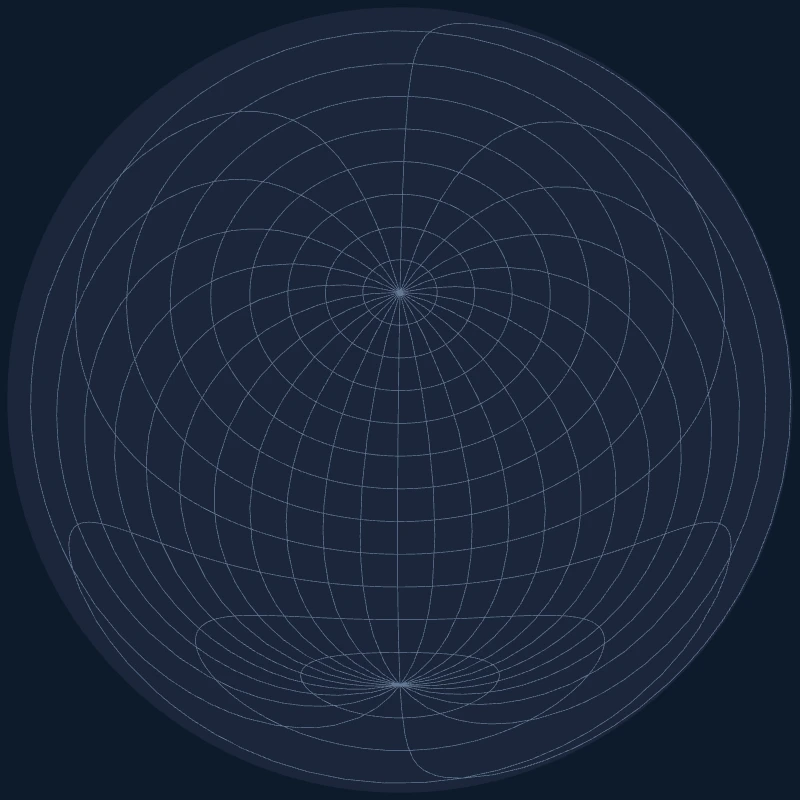
Step 3: Add Graticules
Graticules are the latitude/longitude grid lines that help readers understand position:
// Create graticule generator
const graticule = d3.geoGraticule()
    .step([15, 15]);  // Lines every 15 degrees

// Add graticule to SVG
svg.append("path")
    .datum(graticule())
    .attr("class", "graticule")
    .attr("d", path);
Step 4: Load and Render World Data
// Load world topology
async function loadMap() {
    const world = await d3.json(
        "https://cdn.jsdelivr.net/npm/world-atlas@2/countries-110m.json"
    );

    // Extract land features
    const land = topojson.feature(world, world.objects.land);
    const countries = topojson.feature(world, world.objects.countries);
    const borders = topojson.mesh(
        world,
        world.objects.countries,
        (a, b) => a !== b
    );

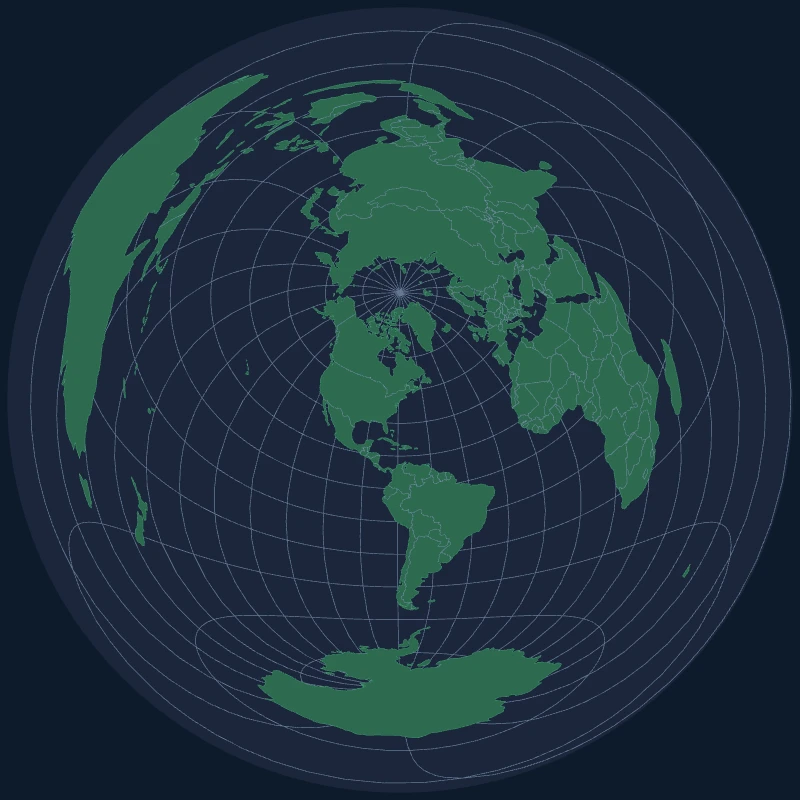
    // Draw land masses
    svg.append("path")
        .datum(land)
        .attr("class", "land")
        .attr("d", path);

    // Draw country borders
    svg.append("path")
        .datum(borders)
        .attr("class", "boundary")
        .attr("d", path);
}

loadMap();
Adding Distance Rings
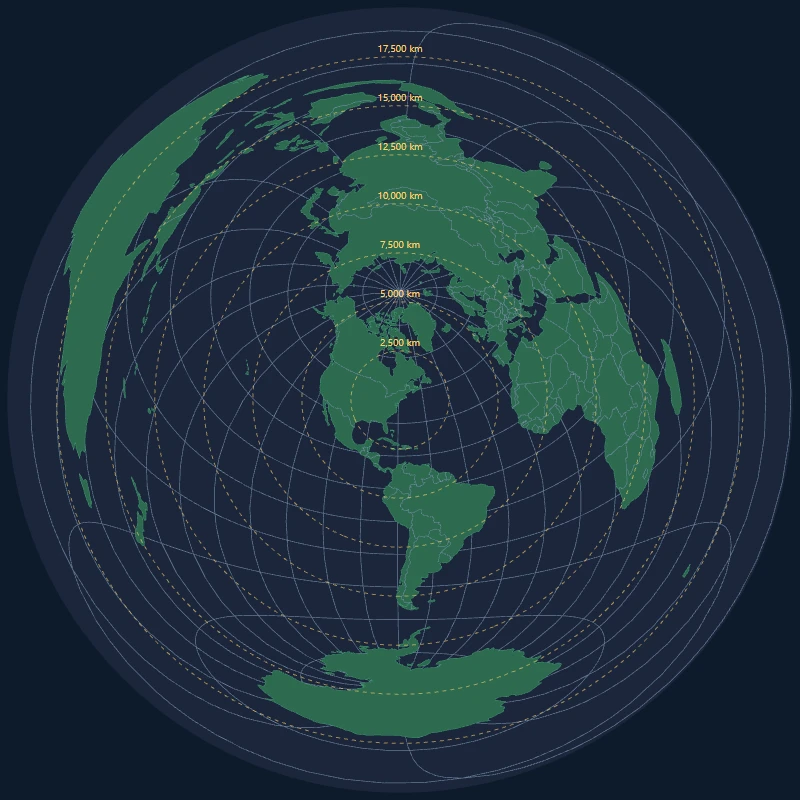
Distance rings help users measure how far locations are from the center point:
function addDistanceRings(svg, projection, centerLat, centerLon) {
    const earthRadius = 6371; // km
    const ringDistances = [2500, 5000, 7500, 10000, 12500, 15000, 17500];

    const ringGroup = svg.append("g").attr("class", "distance-rings");

    ringDistances.forEach(distance => {
        // Calculate angular distance
        const angularDistance = (distance / earthRadius) * (180 / Math.PI);

        // Create a circle at this distance from center
        const ring = d3.geoCircle()
            .center([centerLon, centerLat])
            .radius(angularDistance);

        ringGroup.append("path")
            .datum(ring())
            .attr("d", path)
            .attr("fill", "none")
            .attr("stroke", "#ffd166")
            .attr("stroke-width", 1)
            .attr("stroke-dasharray", "4,4")
            .attr("opacity", 0.6);

        // Place the label on the upward radial ray in projected coordinates.
        // This remains valid when a geographic "due north" point crosses a pole.
        const [centerX, centerY] = projection.translate();
        const labelRadius = projection.scale() * (distance / earthRadius);
        ringGroup.append("text")
            .attr("x", centerX + 5)
            .attr("y", centerY - labelRadius)
            .attr("fill", "#ffd166")
            .attr("font-size", "10px")
            .text(`${distance.toLocaleString()} km`);
    });
}
Adding Azimuth Labels
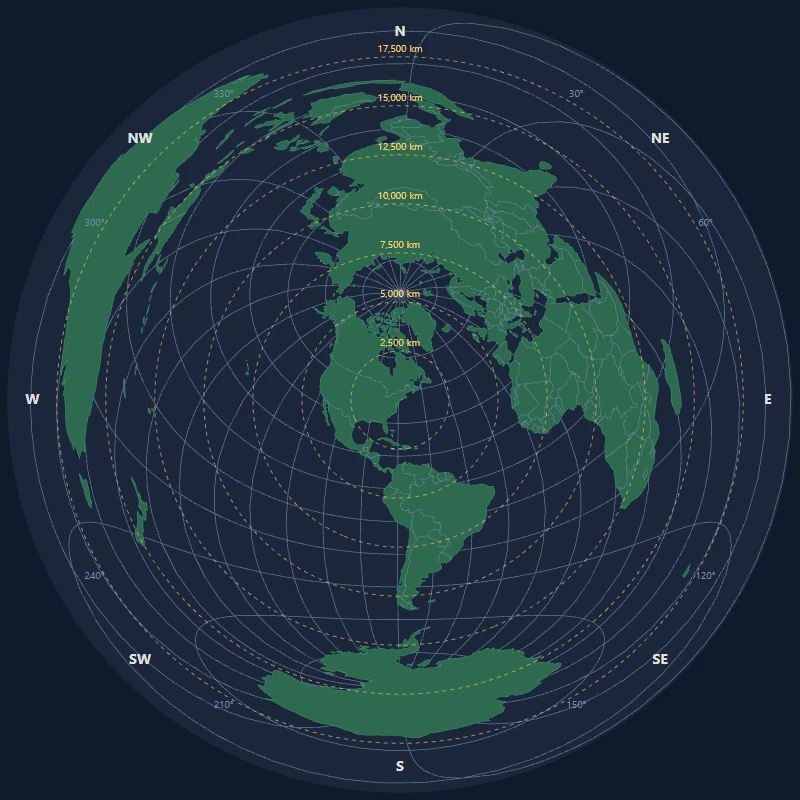
Azimuth labels around the edge show compass directions:
function addAzimuthLabels(svg, width, height) {
    const centerX = width / 2;
    const centerY = height / 2;
    const radius = Math.min(width, height) / 2 - 20;

    const directions = [
        { angle: 0, label: "N" },
        { angle: 45, label: "NE" },
        { angle: 90, label: "E" },
        { angle: 135, label: "SE" },
        { angle: 180, label: "S" },
        { angle: 225, label: "SW" },
        { angle: 270, label: "W" },
        { angle: 315, label: "NW" }
    ];

    const labelGroup = svg.append("g").attr("class", "azimuth-labels");

    directions.forEach(({ angle, label }) => {
        // Convert to radians (0° is North, clockwise)
        const radians = (angle - 90) * (Math.PI / 180);

        const x = centerX + radius * Math.cos(radians);
        const y = centerY + radius * Math.sin(radians);

        labelGroup.append("text")
            .attr("x", x)
            .attr("y", y)
            .attr("text-anchor", "middle")
            .attr("dominant-baseline", "middle")
            .attr("fill", "#e0e1dd")
            .attr("font-size", "14px")
            .attr("font-weight", "bold")
            .text(label);
    });

    // Add degree markers every 30°
    for (let deg = 0; deg < 360; deg += 30) {
        if (deg % 45 !== 0) {  // Skip cardinal/intercardinal
            const radians = (deg - 90) * (Math.PI / 180);
            const x = centerX + (radius - 10) * Math.cos(radians);
            const y = centerY + (radius - 10) * Math.sin(radians);

            labelGroup.append("text")
                .attr("x", x)
                .attr("y", y)
                .attr("text-anchor", "middle")
                .attr("fill", "#778da9")
                .attr("font-size", "10px")
                .text(`${deg}°`);
        }
    }
}
Making It Interactive
Changing the Center Point
Allow users to click anywhere to re-center the map:
svg.on("click", function(event) {
    const [x, y] = d3.pointer(event);
    const coords = projection.invert([x, y]);

    if (coords) {
        const [newLon, newLat] = coords;
        updateProjection(newLat, newLon);
    }
});

function updateProjection(lat, lon) {
    projection.rotate([-lon, -lat]);

    // Transition all paths smoothly
    svg.selectAll("path")
        .transition()
        .duration(750)
        .attr("d", path);

    // Update rings and labels...
}
Adding Zoom
// Append map marks to this group rather than directly to the SVG.
const mapLayer = svg.append("g").attr("class", "map-layer");

const zoom = d3.zoom()
    .scaleExtent([0.5, 8])
    .on("zoom", (event) => {
        mapLayer.attr("transform", event.transform);
    });

svg.call(zoom);
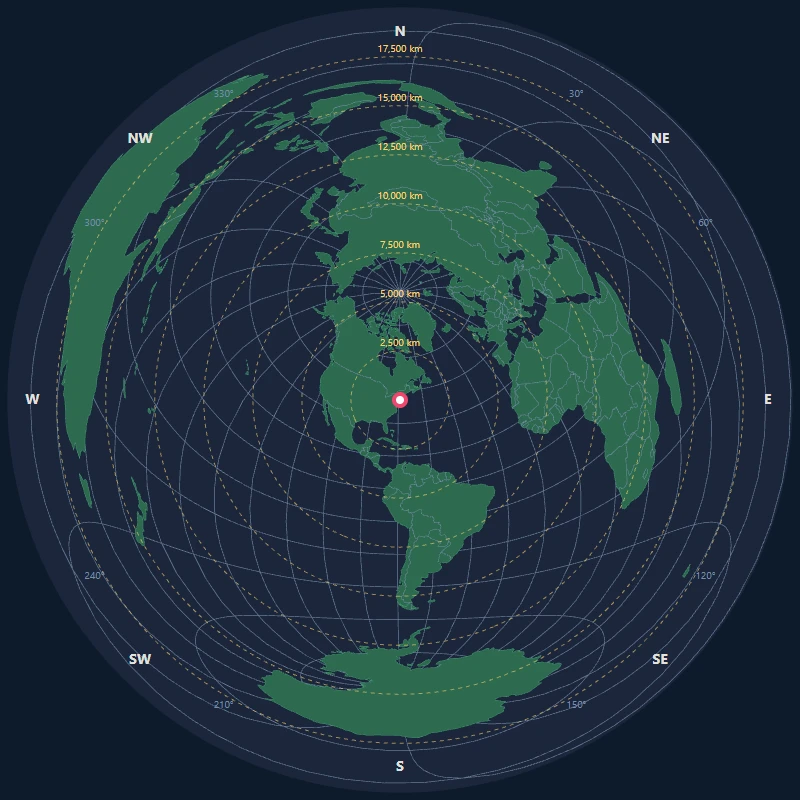
Complete Base Map Example
This map.js example combines the projection, graticule, land and boundary geometry, and center marker. The optional ring and interaction functions above can then be added to the same map layer.
(async function() {
    // Configuration
    const width = 800;
    const height = 800;
    let centerLat = 40.7128;
    let centerLon = -74.0060;

    // Create SVG
    const svg = d3.select("#map-container")
        .append("svg")
        .attr("width", width)
        .attr("height", height);

    // Create projection
    const projection = d3.geoAzimuthalEquidistant()
        .rotate([-centerLon, -centerLat])
        .scale(125)
        .translate([width / 2, height / 2])
        .clipAngle(179.9);

    const path = d3.geoPath().projection(projection);

    // Ocean background
    svg.append("circle")
        .attr("cx", width / 2)
        .attr("cy", height / 2)
        .attr("r", projection.scale() * Math.PI)
        .attr("class", "ocean");

    // Graticules
    const graticule = d3.geoGraticule().step([15, 15]);
    svg.append("path")
        .datum(graticule())
        .attr("class", "graticule")
        .attr("d", path);

    // Load and render world
    const world = await d3.json(
        "https://cdn.jsdelivr.net/npm/world-atlas@2/countries-110m.json"
    );

    const land = topojson.feature(world, world.objects.land);
    const borders = topojson.mesh(
        world,
        world.objects.countries,
        (a, b) => a !== b
    );

    svg.append("path")
        .datum(land)
        .attr("class", "land")
        .attr("d", path);

    svg.append("path")
        .datum(borders)
        .attr("class", "boundary")
        .attr("d", path);

    // Add center marker
    const center = projection([centerLon, centerLat]);
    svg.append("circle")
        .attr("cx", center[0])
        .attr("cy", center[1])
        .attr("r", 5)
        .attr("fill", "#ef476f");

    console.log("Azimuthal Equidistant map centered on:", centerLat, centerLon);
})();
Performance Tips
- Use TopoJSON instead of GeoJSON—it's significantly smaller
- Simplify geometries for large datasets using
topojson.simplify() - Use Canvas for very detailed maps:
const context = canvas.getContext("2d");
const path = d3.geoPath()
    .projection(projection)
    .context(context);
- Throttle interactions when re-rendering on pan/zoom
Common Pitfalls
1. Rotation Direction
Remember: D3's .rotate() takes negative values of your center coordinates:
// To center on New York (40.7°N, 74°W)
.rotate([74.006, -40.7128])  // Note the signs!
2. Clip Angle
clipAngle(90)shows a hemisphereclipAngle(180)shows the full globe (with severe distortion at edges)
3. Antimeridian Cutting
D3 handles the antimeridian (180°/-180° longitude) automatically, but complex polygons may need preprocessing.
Next Steps
- Add tooltips showing country names and distances
- Implement a search box to center on any location
- Add a layer for cities or custom markers
- Export the map as SVG or PNG
Check out our Lambert Equal-Area tutorial for a projection that preserves area instead of distance.